Search for Indicators
All Data
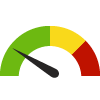
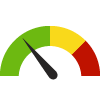
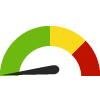
Indicator Gauge Icon Legend
Legend Colors
Red is bad, green is good, blue is not statistically different/neutral.
Compared to Distribution
 the value is in the best half of communities.
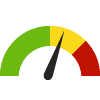 the value is in the 2nd worst quarter of communities.
 the value is in the worst quarter of communities.
Compared to Target
 meets target;
  does not meet target.
Compared to a Single Value
 lower than the comparison value;
 higher than the comparison value;
 not statistically different from comparison value.
Trend

 non-significant change over time;
 significant change over time;
  no change over time.
Compared to Prior Value
 higher than the previous measurement period;
 lower than the previous measurement period;
 no statistically different change from previous measurement period.
County: Laramie
Health / Alcohol & Drug Use
Value
Compared to:
County: Laramie Adults who Binge Drink
County: Laramie Adults who Binge Drink
14.1%
(2017-2021)
Compared to:
WY Counties
The distribution is based on data from 23 Wyoming counties.
WY Value
(15.9%)
The regional value is compared to the Wyoming State value.
Prior Value
(15.2%)
Prior Value compares a measured value with the previously measured value. Confidence intervals were taken into account in determining the direction of the comparison.
County: Laramie Age-Adjusted Drug and Opioid-Involved Overdose Death Rate
County: Laramie Age-Adjusted Drug and Opioid-Involved Overdose Death Rate
14.8
Deaths per 100,000 population
(2018-2020)
Compared to:

U.S. Counties
The distribution is based on data from 1,303 U.S. counties and county equivalents.
WY Value
(14.2)
The regional value is compared to the Wyoming State value.
US Value
(23.5)
The regional value is compared to the national value.
Prior Value
(15.2)
Prior Value compares a measured value with the previously measured value. Confidence intervals were taken into account in determining the direction of the comparison.
County: Laramie Death Rate due to Drug Poisoning
County: Laramie Death Rate due to Drug Poisoning
14.0
Deaths per 100,000 population
(2018-2020)
Compared to:
U.S. Counties
The distribution is based on data from 1,797 U.S. counties and county equivalents.
WY Value
(14.0)
The regional value is compared to the Wyoming State value.
US Value
(23.0)
The regional value is compared to the national value.
Prior Value
(13.1)
Prior Value compares a measured value with the previously measured value. Confidence intervals were taken into account in determining the direction of the comparison.
Trend
This comparison measures the indicator’s values over multiple time periods.<br>The Mann-Kendall Test for Statistical Significance is used to evaluate the trend<br>over 4 to 10 periods of measure, subject to data availability and comparability.
HP 2030 Target
(20.7)
<div>SU-03: Reduce drug overdose deaths <strong>(LEADING HEALTH INDICATOR)</strong></div>
County: Laramie Teens who Binge Drink
County: Laramie Teens who Binge Drink
11.3%
(2022)
Compared to:
WY Value
(17.6% in 2020)
The regional value is compared to the Wyoming State value.
Prior Value
(23.5%)
Prior Value compares a measured value with the previously measured value. Confidence intervals were not taken into account in determining the direction of the comparison.
Trend
This comparison measures the indicator’s values over multiple time periods.<br>The Mann-Kendall Test for Statistical Significance is used to evaluate the trend<br>over 4 to 10 periods of measure, subject to data availability and comparability.
County: Laramie
Health / Cancer
Value
Compared to:
County: Laramie Adults with Cancer
County: Laramie Adults with Cancer
7.2%
(2021)
Compared to:
WY Counties
The distribution is based on data from 23 Wyoming counties.
U.S. Counties
The distribution is based on data from 3,074 U.S. counties and county equivalents.
US Value
(7.0%)
The regional value is compared to the national value.
County: Laramie Age-Adjusted Death Rate due to Breast Cancer
County: Laramie Age-Adjusted Death Rate due to Breast Cancer
20.0
Deaths per 100,000 females
(2016-2020)
Compared to:

U.S. Counties
The distribution is based on data from 1,755 U.S. counties and county equivalents.
WY Value
(18.6)
The regional value is compared to the Wyoming State value.
US Value
(19.6)
The regional value is compared to the national value.
Prior Value
(21.9)
Prior Value compares a measured value with the previously measured value. Confidence intervals were taken into account in determining the direction of the comparison.
Trend
This comparison measures the indicator’s values over multiple time periods.<br>The Mann-Kendall Test for Statistical Significance is used to evaluate the trend<br>over 4 to 10 periods of measure, subject to data availability and comparability.
HP 2030 Target
(15.3)
County: Laramie Age-Adjusted Death Rate due to Cancer
County: Laramie Age-Adjusted Death Rate due to Cancer
145.8
Deaths per 100,000 population
(2016-2020)
Compared to:
WY Counties
The distribution is based on data from 23 Wyoming counties.
U.S. Counties
The distribution is based on data from 3,085 U.S. counties and county equivalents.
WY Value
(138.0)
The regional value is compared to the Wyoming State value.
US Value
(149.4)
The regional value is compared to the national value.
Prior Value
(144.8)
Prior Value compares a measured value with the previously measured value. Confidence intervals were taken into account in determining the direction of the comparison.
Trend
This comparison measures the indicator’s values over multiple time periods.<br>The Mann-Kendall Test for Statistical Significance is used to evaluate the trend<br>over 4 to 10 periods of measure, subject to data availability and comparability.
HP 2030 Target
(122.7)
County: Laramie Age-Adjusted Death Rate due to Colorectal Cancer
County: Laramie Age-Adjusted Death Rate due to Colorectal Cancer
11.0
Deaths per 100,000 population
(2016-2020)
Compared to:
U.S. Counties
The distribution is based on data from 2,174 U.S. counties and county equivalents.
WY Value
(12.3)
The regional value is compared to the Wyoming State value.
US Value
(13.1)
The regional value is compared to the national value.
Prior Value
(11.9)
Prior Value compares a measured value with the previously measured value. Confidence intervals were taken into account in determining the direction of the comparison.
Trend
This comparison measures the indicator’s values over multiple time periods.<br>The Mann-Kendall Test for Statistical Significance is used to evaluate the trend<br>over 4 to 10 periods of measure, subject to data availability and comparability.
HP 2030 Target
(8.9)
County: Laramie Age-Adjusted Death Rate due to Lung Cancer
County: Laramie Age-Adjusted Death Rate due to Lung Cancer
31.3
Deaths per 100,000 population
(2016-2020)
Compared to:
WY Counties
The distribution is based on data from 20 Wyoming counties.
U.S. Counties
The distribution is based on data from 2,752 U.S. counties and county equivalents.
WY Value
(28.9)
The regional value is compared to the Wyoming State value.
US Value
(35.0)
The regional value is compared to the national value.
Prior Value
(31.7)
Prior Value compares a measured value with the previously measured value. Confidence intervals were taken into account in determining the direction of the comparison.
Trend
This comparison measures the indicator’s values over multiple time periods.<br>The Mann-Kendall Test for Statistical Significance is used to evaluate the trend<br>over 4 to 10 periods of measure, subject to data availability and comparability.
HP 2030 Target
(25.1)
County: Laramie Age-Adjusted Death Rate due to Prostate Cancer
County: Laramie Age-Adjusted Death Rate due to Prostate Cancer
17.0
Deaths per 100,000 males
(2016-2020)
Compared to:
U.S. Counties
The distribution is based on data from 1,576 U.S. counties and county equivalents.
WY Value
(18.4)
The regional value is compared to the Wyoming State value.
US Value
(18.8)
The regional value is compared to the national value.
Prior Value
(12.5)
Prior Value compares a measured value with the previously measured value. Confidence intervals were taken into account in determining the direction of the comparison.
Trend
This comparison measures the indicator’s values over multiple time periods.<br>The Mann-Kendall Test for Statistical Significance is used to evaluate the trend<br>over 4 to 10 periods of measure, subject to data availability and comparability.
HP 2030 Target
(16.9)
County: Laramie All Cancer Incidence Rate
County: Laramie All Cancer Incidence Rate
450.4
Cases per 100,000 population
(2016-2020)
Compared to:

WY Counties
The distribution is based on data from 23 Wyoming counties.
U.S. Counties
The distribution is based on data from 2,693 U.S. counties and county equivalents.
WY Value
(404.3)
The regional value is compared to the Wyoming State value.
US Value
(442.3)
The regional value is compared to the national value.
Prior Value
(458.5)
Prior Value compares a measured value with the previously measured value. Confidence intervals were taken into account in determining the direction of the comparison.
Trend
This comparison measures the indicator’s values over multiple time periods.<br>The Mann-Kendall Test for Statistical Significance is used to evaluate the trend<br>over 4 to 10 periods of measure, subject to data availability and comparability.
County: Laramie Breast Cancer Incidence Rate
County: Laramie Breast Cancer Incidence Rate
115.8
Cases per 100,000 females
(2016-2020)
Compared to:
WY Counties
The distribution is based on data from 22 Wyoming counties.
U.S. Counties
The distribution is based on data from 2,478 U.S. counties and county equivalents.
WY Value
(116.0)
The regional value is compared to the Wyoming State value.
US Value
(127.0)
The regional value is compared to the national value.
Prior Value
(115.2)
Prior Value compares a measured value with the previously measured value. Confidence intervals were taken into account in determining the direction of the comparison.
Trend
This comparison measures the indicator’s values over multiple time periods.<br>The Mann-Kendall Test for Statistical Significance is used to evaluate the trend<br>over 4 to 10 periods of measure, subject to data availability and comparability.
County: Laramie Cancer: Medicare Population
County: Laramie Cancer: Medicare Population
10.0%
(2022)
Compared to:

WY Counties
The distribution is based on data from 23 Wyoming counties.
U.S. Counties
The distribution is based on data from 3,129 U.S. counties and county equivalents.
WY Value
(9.0%)
The regional value is compared to the Wyoming State value.
US Value
(12.0%)
The regional value is compared to the national value.
Prior Value
(10.0%)
Prior Value compares a measured value with the previously measured value. Confidence intervals were not taken into account in determining the direction of the comparison.
Trend
This comparison measures the indicator’s values over multiple time periods.<br>The Mann-Kendall Test for Statistical Significance is used to evaluate the trend<br>over 4 to 10 periods of measure, subject to data availability and comparability.
County: Laramie Cervical Cancer Incidence Rate
County: Laramie Cervical Cancer Incidence Rate
8.3
Cases per 100,000 females
(2016-2020)
Compared to:
U.S. Counties
The distribution is based on data from 696 U.S. counties and county equivalents.
WY Value
(8.8)
The regional value is compared to the Wyoming State value.
US Value
(7.5)
The regional value is compared to the national value.
Prior Value
(7.1)
Prior Value compares a measured value with the previously measured value. Confidence intervals were taken into account in determining the direction of the comparison.
Trend
This comparison measures the indicator’s values over multiple time periods.<br>The Mann-Kendall Test for Statistical Significance is used to evaluate the trend<br>over 4 to 10 periods of measure, subject to data availability and comparability.
County: Laramie Cervical Cancer Screening: 21-65
County: Laramie Cervical Cancer Screening: 21-65
81.5%
(2020)
Compared to:

WY Counties
The distribution is based on data from 23 Wyoming counties.
U.S. Counties
The distribution is based on data from 3,141 U.S. counties and county equivalents.
US Value
(82.8%)
The regional value is compared to the national value.
County: Laramie Colon Cancer Screening: USPSTF Recommendation
County: Laramie Colon Cancer Screening: USPSTF Recommendation
64.3%
(2020)
Compared to:
WY Counties
The distribution is based on data from 23 Wyoming counties.
U.S. Counties
The distribution is based on data from 3,141 U.S. counties and county equivalents.
US Value
(72.4%)
The regional value is compared to the national value.
County: Laramie Colorectal Cancer Incidence Rate
County: Laramie Colorectal Cancer Incidence Rate
34.9
Cases per 100,000 population
(2016-2020)
Compared to:
U.S. Counties
The distribution is based on data from 2,401 U.S. counties and county equivalents.
WY Value
(34.8)
The regional value is compared to the Wyoming State value.
US Value
(36.5)
The regional value is compared to the national value.
Prior Value
(36.0)
Prior Value compares a measured value with the previously measured value. Confidence intervals were taken into account in determining the direction of the comparison.
Trend
This comparison measures the indicator’s values over multiple time periods.<br>The Mann-Kendall Test for Statistical Significance is used to evaluate the trend<br>over 4 to 10 periods of measure, subject to data availability and comparability.
County: Laramie Lung and Bronchus Cancer Incidence Rate
County: Laramie Lung and Bronchus Cancer Incidence Rate
45.5
Cases per 100,000 population
(2016-2020)
Compared to:
WY Counties
The distribution is based on data from 20 Wyoming counties.
U.S. Counties
The distribution is based on data from 2,471 U.S. counties and county equivalents.
WY Value
(40.4)
The regional value is compared to the Wyoming State value.
US Value
(54.0)
The regional value is compared to the national value.
Prior Value
(46.5)
Prior Value compares a measured value with the previously measured value. Confidence intervals were taken into account in determining the direction of the comparison.
Trend
This comparison measures the indicator’s values over multiple time periods.<br>The Mann-Kendall Test for Statistical Significance is used to evaluate the trend<br>over 4 to 10 periods of measure, subject to data availability and comparability.
County: Laramie Mammography Screening: Medicare Population
County: Laramie Mammography Screening: Medicare Population
44.0%
(2022)
Compared to:

WY Counties
The distribution is based on data from 23 Wyoming counties.
U.S. Counties
The distribution is based on data from 3,123 U.S. counties and county equivalents.
WY Value
(40.0%)
The regional value is compared to the Wyoming State value.
US Value
(47.0%)
The regional value is compared to the national value.
Prior Value
(44.0%)
Prior Value compares a measured value with the previously measured value. Confidence intervals were not taken into account in determining the direction of the comparison.
Trend
This comparison measures the indicator’s values over multiple time periods.<br>The Mann-Kendall Test for Statistical Significance is used to evaluate the trend<br>over 4 to 10 periods of measure, subject to data availability and comparability.
County: Laramie Melanoma Incidence Rate
County: Laramie Melanoma Incidence Rate
22.9
Cases per 100,000 population
(2016-2020)
Compared to:
U.S. Counties
The distribution is based on data from 1,961 U.S. counties and county equivalents.
WY Value
(23.8)
The regional value is compared to the Wyoming State value.
US Value
(22.5)
The regional value is compared to the national value.
Prior Value
(25.2)
Prior Value compares a measured value with the previously measured value. Confidence intervals were taken into account in determining the direction of the comparison.
Trend
This comparison measures the indicator’s values over multiple time periods.<br>The Mann-Kendall Test for Statistical Significance is used to evaluate the trend<br>over 4 to 10 periods of measure, subject to data availability and comparability.
County: Laramie Non-Hodgkin Lymphoma Incidence Rate
County: Laramie Non-Hodgkin Lymphoma Incidence Rate
18.9
Cases per 100,000 population
(2016-2020)
Compared to:
U.S. Counties
The distribution is based on data from 1,912 U.S. counties and county equivalents.
WY Value
(15.9)
The regional value is compared to the Wyoming State value.
US Value
(18.6)
The regional value is compared to the national value.
Prior Value
(18.7)
Prior Value compares a measured value with the previously measured value. Confidence intervals were taken into account in determining the direction of the comparison.
Trend
This comparison measures the indicator’s values over multiple time periods.<br>The Mann-Kendall Test for Statistical Significance is used to evaluate the trend<br>over 4 to 10 periods of measure, subject to data availability and comparability.
County: Laramie Oral Cavity and Pharynx Cancer Incidence Rate
County: Laramie Oral Cavity and Pharynx Cancer Incidence Rate
13.9
Cases per 100,000 population
(2016-2020)
Compared to:
U.S. Counties
The distribution is based on data from 1,706 U.S. counties and county equivalents.
WY Value
(10.8)
The regional value is compared to the Wyoming State value.
US Value
(11.9)
The regional value is compared to the national value.
Prior Value
(14.2)
Prior Value compares a measured value with the previously measured value. Confidence intervals were taken into account in determining the direction of the comparison.
Trend
This comparison measures the indicator’s values over multiple time periods.<br>The Mann-Kendall Test for Statistical Significance is used to evaluate the trend<br>over 4 to 10 periods of measure, subject to data availability and comparability.
County: Laramie Ovarian Cancer Incidence Rate
County: Laramie Ovarian Cancer Incidence Rate
6.6
Cases per 100,000 females
(2016-2020)
Compared to:
U.S. Counties
The distribution is based on data from 908 U.S. counties and county equivalents.
WY Value
(9.4)
The regional value is compared to the Wyoming State value.
US Value
(10.1)
The regional value is compared to the national value.
Prior Value
(8.8)
Prior Value compares a measured value with the previously measured value. Confidence intervals were taken into account in determining the direction of the comparison.
Trend
This comparison measures the indicator’s values over multiple time periods.<br>The Mann-Kendall Test for Statistical Significance is used to evaluate the trend<br>over 4 to 10 periods of measure, subject to data availability and comparability.
County: Laramie Prostate Cancer Incidence Rate
County: Laramie Prostate Cancer Incidence Rate
140.2
Cases per 100,000 males
(2016-2020)
Compared to:
WY Counties
The distribution is based on data from 22 Wyoming counties.
U.S. Counties
The distribution is based on data from 2,500 U.S. counties and county equivalents.
WY Value
(113.7)
The regional value is compared to the Wyoming State value.
US Value
(110.5)
The regional value is compared to the national value.
Prior Value
(137.7)
Prior Value compares a measured value with the previously measured value. Confidence intervals were taken into account in determining the direction of the comparison.
Trend
This comparison measures the indicator’s values over multiple time periods.<br>The Mann-Kendall Test for Statistical Significance is used to evaluate the trend<br>over 4 to 10 periods of measure, subject to data availability and comparability.
County: Laramie
Health / Diabetes
Value
Compared to:
County: Laramie Adults with Diabetes
County: Laramie Adults with Diabetes
10.4%
(2017-2021)
Compared to:
WY Counties
The distribution is based on data from 23 Wyoming counties.
WY Value
(8.8%)
The regional value is compared to the Wyoming State value.
Prior Value
(11.0%)
Prior Value compares a measured value with the previously measured value. Confidence intervals were taken into account in determining the direction of the comparison.
County: Laramie Age-Adjusted Death Rate due to Diabetes
County: Laramie Age-Adjusted Death Rate due to Diabetes
25.5
Deaths per 100,000 population
(2018-2020)
Compared to:
U.S. Counties
The distribution is based on data from 1,937 U.S. counties and county equivalents.
WY Value
(20.2)
The regional value is compared to the Wyoming State value.
US Value
(22.6)
The regional value is compared to the national value.
Prior Value
(22.3)
Prior Value compares a measured value with the previously measured value. Confidence intervals were taken into account in determining the direction of the comparison.
Trend
This comparison measures the indicator’s values over multiple time periods.<br>The Mann-Kendall Test for Statistical Significance is used to evaluate the trend<br>over 4 to 10 periods of measure, subject to data availability and comparability.
County: Laramie Diabetes: Medicare Population
County: Laramie Diabetes: Medicare Population
20.0%
(2022)
Compared to:
WY Counties
The distribution is based on data from 23 Wyoming counties.
U.S. Counties
The distribution is based on data from 3,129 U.S. counties and county equivalents.
WY Value
(18.0%)
The regional value is compared to the Wyoming State value.
US Value
(24.0%)
The regional value is compared to the national value.
Prior Value
(20.0%)
Prior Value compares a measured value with the previously measured value. Confidence intervals were not taken into account in determining the direction of the comparison.
Trend
This comparison measures the indicator’s values over multiple time periods.<br>The Mann-Kendall Test for Statistical Significance is used to evaluate the trend<br>over 4 to 10 periods of measure, subject to data availability and comparability.
County: Laramie
Health / Disabilities
Value
Compared to:
County: Laramie Adults with Disability
County: Laramie Adults with Disability
12.2%
(2022)
Compared to:


WY Value
(11.8%)
The regional value is compared to the Wyoming State value.
Prior Value
(11.4%)
Prior Value compares a measured value with the previously measured value. Confidence intervals were taken into account in determining the direction of the comparison.
Trend
This comparison measures the indicator’s values over multiple time periods.<br>The Mann-Kendall Test for Statistical Significance is used to evaluate the trend<br>over 4 to 10 periods of measure, subject to data availability and comparability.
County: Laramie Adults with Disability Living in Poverty
County: Laramie Adults with Disability Living in Poverty
19.2%
(2018-2022)
Compared to:
WY Counties
The distribution is based on data from 23 Wyoming counties.
U.S. Counties
The distribution is based on data from 3,132 U.S. counties and county equivalents.
WY Value
(20.7%)
The regional value is compared to the Wyoming State value.
US Value
(24.9%)
The regional value is compared to the national value.
Trend
This comparison measures the indicator’s values over multiple time periods.<br>The Mann-Kendall Test for Statistical Significance is used to evaluate the trend<br>over 4 to 10 periods of measure, subject to data availability and comparability.
County: Laramie Children with a Disability
County: Laramie Children with a Disability
8.1%
(2022)
Compared to:

WY Value
(4.5%)
The regional value is compared to the Wyoming State value.
Prior Value
(2.1%)
Prior Value compares a measured value with the previously measured value. Confidence intervals were taken into account in determining the direction of the comparison.
Trend
This comparison measures the indicator’s values over multiple time periods.<br>The Mann-Kendall Test for Statistical Significance is used to evaluate the trend<br>over 4 to 10 periods of measure, subject to data availability and comparability.
County: Laramie Persons with a Cognitive Difficulty
County: Laramie Persons with a Cognitive Difficulty
4.7%
(2018-2022)
Compared to:

WY Value
(4.7%)
The regional value is compared to the Wyoming State value.
US Value
(5.3%)
The regional value is compared to the national value.
Trend
This comparison measures the indicator’s values over multiple time periods.<br>The Mann-Kendall Test for Statistical Significance is used to evaluate the trend<br>over 4 to 10 periods of measure, subject to data availability and comparability.
County: Laramie Persons with a Disability
County: Laramie Persons with a Disability
15.6%
(2022)
Compared to:

WY Value
(14.4%)
The regional value is compared to the Wyoming State value.
Prior Value
(14.0%)
Prior Value compares a measured value with the previously measured value. Confidence intervals were not taken into account in determining the direction of the comparison.
Trend
This comparison measures the indicator’s values over multiple time periods.<br>The Mann-Kendall Test for Statistical Significance is used to evaluate the trend<br>over 4 to 10 periods of measure, subject to data availability and comparability.
County: Laramie Persons with a Disability
County: Laramie Persons with a Disability
14.0%
(2018-2022)
Compared to:

WY Value
(13.5%)
The regional value is compared to the Wyoming State value.
US Value
(12.9%)
The regional value is compared to the national value.
Trend
This comparison measures the indicator’s values over multiple time periods.<br>The Mann-Kendall Test for Statistical Significance is used to evaluate the trend<br>over 4 to 10 periods of measure, subject to data availability and comparability.
County: Laramie Persons with a Hearing Difficulty
County: Laramie Persons with a Hearing Difficulty
5.6%
(2018-2022)
Compared to:
WY Value
(5.2%)
The regional value is compared to the Wyoming State value.
US Value
(3.6%)
The regional value is compared to the national value.
Trend
This comparison measures the indicator’s values over multiple time periods.<br>The Mann-Kendall Test for Statistical Significance is used to evaluate the trend<br>over 4 to 10 periods of measure, subject to data availability and comparability.
County: Laramie Persons with a Self-Care Difficulty
County: Laramie Persons with a Self-Care Difficulty
2.2%
(2018-2022)
Compared to:
WY Value
(1.9%)
The regional value is compared to the Wyoming State value.
US Value
(2.6%)
The regional value is compared to the national value.
Trend
This comparison measures the indicator’s values over multiple time periods.<br>The Mann-Kendall Test for Statistical Significance is used to evaluate the trend<br>over 4 to 10 periods of measure, subject to data availability and comparability.
County: Laramie Persons with a Vision Difficulty
County: Laramie Persons with a Vision Difficulty
2.2%
(2018-2022)
Compared to:
WY Value
(2.3%)
The regional value is compared to the Wyoming State value.
US Value
(2.4%)
The regional value is compared to the national value.
Trend
This comparison measures the indicator’s values over multiple time periods.<br>The Mann-Kendall Test for Statistical Significance is used to evaluate the trend<br>over 4 to 10 periods of measure, subject to data availability and comparability.
County: Laramie Persons with an Ambulatory Difficulty
County: Laramie Persons with an Ambulatory Difficulty
6.8%
(2018-2022)
Compared to:
WY Value
(6.2%)
The regional value is compared to the Wyoming State value.
US Value
(6.7%)
The regional value is compared to the national value.
Trend
This comparison measures the indicator’s values over multiple time periods.<br>The Mann-Kendall Test for Statistical Significance is used to evaluate the trend<br>over 4 to 10 periods of measure, subject to data availability and comparability.
County: Laramie
Health / Family Planning
Value
Compared to:
County: Laramie Infants Born to Mothers with <12 Years Education
County: Laramie Infants Born to Mothers with <12 Years Education
6.6%
(2022)
Compared to:
Prior Value
(7.2%)
Prior Value compares a measured value with the previously measured value. Confidence intervals were not taken into account in determining the direction of the comparison.
Trend
This comparison measures the indicator’s values over multiple time periods.<br>The Mann-Kendall Test for Statistical Significance is used to evaluate the trend<br>over 4 to 10 periods of measure, subject to data availability and comparability.
County: Laramie Teen Birth Rate: 15-19
County: Laramie Teen Birth Rate: 15-19
15.2
Live births per 1,000 females aged 15-19
(2022)
Compared to:
Prior Value
(15.8)
Prior Value compares a measured value with the previously measured value. Confidence intervals were not taken into account in determining the direction of the comparison.
Trend
This comparison measures the indicator’s values over multiple time periods.<br>The Mann-Kendall Test for Statistical Significance is used to evaluate the trend<br>over 4 to 10 periods of measure, subject to data availability and comparability.
County: Laramie
Health / Food Safety
Value
Compared to:
County: Laramie E. coli Infection Incidence Rate
County: Laramie E. coli Infection Incidence Rate
7.1
Cases per 100,000 population
(2017)
Compared to:

WY Value
(4.1)
The regional value is compared to the Wyoming State value.
Prior Value
(0.0)
Prior Value compares a measured value with the previously measured value. Confidence intervals were not taken into account in determining the direction of the comparison.
Trend
This comparison measures the indicator’s values over multiple time periods.<br>The Mann-Kendall Test for Statistical Significance is used to evaluate the trend<br>over 4 to 10 periods of measure, subject to data availability and comparability.
HP 2030 Target
(3.7)
County: Laramie Salmonella Infection Incidence Rate
County: Laramie Salmonella Infection Incidence Rate
14.2
Cases per 100,000 population
(2017)
Compared to:
WY Counties
The distribution is based on data from 23 Wyoming counties.
WY Value
(17.3)
The regional value is compared to the Wyoming State value.
Prior Value
(14.3)
Prior Value compares a measured value with the previously measured value. Confidence intervals were not taken into account in determining the direction of the comparison.
Trend
This comparison measures the indicator’s values over multiple time periods.<br>The Mann-Kendall Test for Statistical Significance is used to evaluate the trend<br>over 4 to 10 periods of measure, subject to data availability and comparability.
HP 2030 Target
(11.5)
County: Laramie
Health / Health Care Access & Quality
Value
Compared to:
County: Laramie Adults who have had a Routine Checkup
County: Laramie Adults who have had a Routine Checkup
71.0%
(2021)
Compared to:
WY Counties
The distribution is based on data from 23 Wyoming counties.
U.S. Counties
The distribution is based on data from 3,074 U.S. counties and county equivalents.
US Value
(73.6%)
The regional value is compared to the national value.
County: Laramie Adults with a Usual Source of Health Care
County: Laramie Adults with a Usual Source of Health Care
73.0%
(2017-2021)
Compared to:
WY Counties
The distribution is based on data from 23 Wyoming counties.
WY Value
(75.4%)
The regional value is compared to the Wyoming State value.
Prior Value
(71.3%)
Prior Value compares a measured value with the previously measured value. Confidence intervals were taken into account in determining the direction of the comparison.
County: Laramie Adults with Health Insurance: 18-64
County: Laramie Adults with Health Insurance: 18-64
85.9%
(2021)
Compared to:
WY Counties
The distribution is based on data from 23 Wyoming counties.
U.S. Counties
The distribution is based on data from 3,140 U.S. counties and county equivalents.
WY Value
(83.0%)
The regional value is compared to the Wyoming State value.
Prior Value
(85.6%)
Prior Value compares a measured value with the previously measured value. Confidence intervals were taken into account in determining the direction of the comparison.
Trend
This comparison measures the indicator’s values over multiple time periods.<br>The Mann-Kendall Test for Statistical Significance is used to evaluate the trend<br>over 4 to 10 periods of measure, subject to data availability and comparability.
County: Laramie Children with Health Insurance
County: Laramie Children with Health Insurance
89.3%
(2021)
Compared to:
WY Counties
The distribution is based on data from 23 Wyoming counties.
U.S. Counties
The distribution is based on data from 3,140 U.S. counties and county equivalents.
WY Value
(88.5%)
The regional value is compared to the Wyoming State value.
Prior Value
(92.9%)
Prior Value compares a measured value with the previously measured value. Confidence intervals were taken into account in determining the direction of the comparison.
Trend
This comparison measures the indicator’s values over multiple time periods.<br>The Mann-Kendall Test for Statistical Significance is used to evaluate the trend<br>over 4 to 10 periods of measure, subject to data availability and comparability.
County: Laramie Medicare Healthcare Costs
County: Laramie Medicare Healthcare Costs
$8,820
Dollars per enrollee
(2015)
Compared to:
WY Value
($8,145)
The regional value is compared to the Wyoming State value.
US Value
($9,729)
The regional value is compared to the national value.
Prior Value
($8,485)
Prior Value compares a measured value with the previously measured value. Confidence intervals were not taken into account in determining the direction of the comparison.
Trend
This comparison measures the indicator’s values over multiple time periods.<br>The Mann-Kendall Test for Statistical Significance is used to evaluate the trend<br>over 4 to 10 periods of measure, subject to data availability and comparability.
County: Laramie Non-Physician Primary Care Provider Rate
County: Laramie Non-Physician Primary Care Provider Rate
162
Providers per 100,000 population
(2022)
Compared to:
WY Counties
The distribution is based on data from 23 Wyoming counties.
U.S. Counties
The distribution is based on data from 3,131 U.S. counties and county equivalents.
WY Value
(130)
The regional value is compared to the Wyoming State value.
Prior Value
(156)
Prior Value compares a measured value with the previously measured value. Confidence intervals were not taken into account in determining the direction of the comparison.
Trend
This comparison measures the indicator’s values over multiple time periods.<br>The Mann-Kendall Test for Statistical Significance is used to evaluate the trend<br>over 4 to 10 periods of measure, subject to data availability and comparability.
County: Laramie Persons with Health Insurance
County: Laramie Persons with Health Insurance
87.0%
(2021)
Compared to:
WY Counties
The distribution is based on data from 23 Wyoming counties.
U.S. Counties
The distribution is based on data from 3,140 U.S. counties and county equivalents.
WY Value
(84.7%)
The regional value is compared to the Wyoming State value.
Prior Value
(87.6%)
Prior Value compares a measured value with the previously measured value. Confidence intervals were taken into account in determining the direction of the comparison.
Trend
This comparison measures the indicator’s values over multiple time periods.<br>The Mann-Kendall Test for Statistical Significance is used to evaluate the trend<br>over 4 to 10 periods of measure, subject to data availability and comparability.
HP 2030 Target
(92.4%)
<div>AHS-01: Increase the proportion of people with health insurance <strong>(LEADING HEALTH INDICATOR)</strong></div>
County: Laramie Persons with Private Health Insurance Only
County: Laramie Persons with Private Health Insurance Only
57.5%
(2022)
Compared to:
WY Value
(57.3%)
The regional value is compared to the Wyoming State value.
US Value
(54.8%)
The regional value is compared to the national value.
Prior Value
(56.2%)
Prior Value compares a measured value with the previously measured value. Confidence intervals were not taken into account in determining the direction of the comparison.
Trend
This comparison measures the indicator’s values over multiple time periods.<br>The Mann-Kendall Test for Statistical Significance is used to evaluate the trend<br>over 4 to 10 periods of measure, subject to data availability and comparability.
County: Laramie Persons with Public Health Insurance Only
County: Laramie Persons with Public Health Insurance Only
15.7%
(2022)
Compared to:
WY Value
(17.6%)
The regional value is compared to the Wyoming State value.
US Value
(24.8%)
The regional value is compared to the national value.
Prior Value
(13.4%)
Prior Value compares a measured value with the previously measured value. Confidence intervals were not taken into account in determining the direction of the comparison.
Trend
This comparison measures the indicator’s values over multiple time periods.<br>The Mann-Kendall Test for Statistical Significance is used to evaluate the trend<br>over 4 to 10 periods of measure, subject to data availability and comparability.
County: Laramie Preventable Hospital Stays: Medicare Population
County: Laramie Preventable Hospital Stays: Medicare Population
3,199.0
Discharges per 100,000 Medicare enrollees
(2022)
Compared to:
WY Counties
The distribution is based on data from 23 Wyoming counties.
U.S. Counties
The distribution is based on data from 3,129 U.S. counties and county equivalents.
WY Value
(2,513.0)
The regional value is compared to the Wyoming State value.
US Value
(2,677.0)
The regional value is compared to the national value.
Prior Value
(2,789.0)
Prior Value compares a measured value with the previously measured value. Confidence intervals were not taken into account in determining the direction of the comparison.
Trend
This comparison measures the indicator’s values over multiple time periods.<br>The Mann-Kendall Test for Statistical Significance is used to evaluate the trend<br>over 4 to 10 periods of measure, subject to data availability and comparability.
County: Laramie Primary Care Provider Rate
County: Laramie Primary Care Provider Rate
71
Providers per 100,000 population
(2020)
Compared to:

WY Counties
The distribution is based on data from 23 Wyoming counties.
U.S. Counties
The distribution is based on data from 2,995 U.S. counties and county equivalents.
WY Value
(70)
The regional value is compared to the Wyoming State value.
Prior Value
(72)
Prior Value compares a measured value with the previously measured value. Confidence intervals were not taken into account in determining the direction of the comparison.
Trend
This comparison measures the indicator’s values over multiple time periods.<br>The Mann-Kendall Test for Statistical Significance is used to evaluate the trend<br>over 4 to 10 periods of measure, subject to data availability and comparability.
County: Laramie
Health / Health Information Technology
Value
Compared to:
County: Laramie Households with an Internet Subscription
County: Laramie Households with an Internet Subscription
90.3%
(2018-2022)
Compared to:
WY Counties
The distribution is based on data from 23 Wyoming counties.
U.S. Counties
The distribution is based on data from 3,133 U.S. counties and county equivalents.
WY Value
(88.4%)
The regional value is compared to the Wyoming State value.
US Value
(88.5%)
The regional value is compared to the national value.
Trend
This comparison measures the indicator’s values over multiple time periods.<br>The Mann-Kendall Test for Statistical Significance is used to evaluate the trend<br>over 4 to 10 periods of measure, subject to data availability and comparability.
County: Laramie Households with One or More Types of Computing Devices
County: Laramie Households with One or More Types of Computing Devices
94.7%
(2018-2022)
Compared to:
WY Counties
The distribution is based on data from 23 Wyoming counties.
U.S. Counties
The distribution is based on data from 3,133 U.S. counties and county equivalents.
WY Value
(94.5%)
The regional value is compared to the Wyoming State value.
US Value
(94.0%)
The regional value is compared to the national value.
Trend
This comparison measures the indicator’s values over multiple time periods.<br>The Mann-Kendall Test for Statistical Significance is used to evaluate the trend<br>over 4 to 10 periods of measure, subject to data availability and comparability.
County: Laramie Persons with an Internet Subscription
County: Laramie Persons with an Internet Subscription
92.0%
(2018-2022)
Compared to:
WY Counties
The distribution is based on data from 23 Wyoming counties.
U.S. Counties
The distribution is based on data from 3,133 U.S. counties and county equivalents.
WY Value
(91.0%)
The regional value is compared to the Wyoming State value.
US Value
(91.0%)
The regional value is compared to the national value.
Trend
This comparison measures the indicator’s values over multiple time periods.<br>The Mann-Kendall Test for Statistical Significance is used to evaluate the trend<br>over 4 to 10 periods of measure, subject to data availability and comparability.
County: Laramie
Health / Heart Disease & Stroke
Value
Compared to:
County: Laramie Adults who Experienced a Stroke
County: Laramie Adults who Experienced a Stroke
2.8%
(2021)
Compared to:
WY Counties
The distribution is based on data from 23 Wyoming counties.
U.S. Counties
The distribution is based on data from 3,074 U.S. counties and county equivalents.
US Value
(3.3%)
The regional value is compared to the national value.
County: Laramie Adults who Experienced Coronary Heart Disease
County: Laramie Adults who Experienced Coronary Heart Disease
5.8%
(2021)
Compared to:
WY Counties
The distribution is based on data from 23 Wyoming counties.
U.S. Counties
The distribution is based on data from 3,074 U.S. counties and county equivalents.
US Value
(6.1%)
The regional value is compared to the national value.
County: Laramie Adults who Have Taken Medications for High Blood Pressure
County: Laramie Adults who Have Taken Medications for High Blood Pressure
76.7%
(2021)
Compared to:
WY Counties
The distribution is based on data from 23 Wyoming counties.
U.S. Counties
The distribution is based on data from 3,074 U.S. counties and county equivalents.
US Value
(78.2%)
The regional value is compared to the national value.
County: Laramie Age-Adjusted Death Rate due to Cerebrovascular Disease (Stroke)
County: Laramie Age-Adjusted Death Rate due to Cerebrovascular Disease (Stroke)
30.9
Deaths per 100,000 population
(2018-2020)
Compared to:
U.S. Counties
The distribution is based on data from 2,338 U.S. counties and county equivalents.
WY Value
(31.5)
The regional value is compared to the Wyoming State value.
US Value
(37.6)
The regional value is compared to the national value.
Prior Value
(31.4)
Prior Value compares a measured value with the previously measured value. Confidence intervals were taken into account in determining the direction of the comparison.
Trend
This comparison measures the indicator’s values over multiple time periods.<br>The Mann-Kendall Test for Statistical Significance is used to evaluate the trend<br>over 4 to 10 periods of measure, subject to data availability and comparability.
HP 2030 Target
(33.4)
County: Laramie Age-Adjusted Death Rate due to Coronary Heart Disease
County: Laramie Age-Adjusted Death Rate due to Coronary Heart Disease
75.4
Deaths per 100,000 population
(2018-2020)
Compared to:
WY Counties
The distribution is based on data from 22 Wyoming counties.
U.S. Counties
The distribution is based on data from 2,852 U.S. counties and county equivalents.
WY Value
(82.4)
The regional value is compared to the Wyoming State value.
US Value
(90.2)
The regional value is compared to the national value.
Prior Value
(81.7)
Prior Value compares a measured value with the previously measured value. Confidence intervals were taken into account in determining the direction of the comparison.
Trend
This comparison measures the indicator’s values over multiple time periods.<br>The Mann-Kendall Test for Statistical Significance is used to evaluate the trend<br>over 4 to 10 periods of measure, subject to data availability and comparability.
HP 2030 Target
(71.1)
County: Laramie Age-Adjusted Death Rate due to Heart Attack
County: Laramie Age-Adjusted Death Rate due to Heart Attack
29.7
Deaths per 100,000 population 35+ years
(2020)
Compared to:
WY Counties
(2016)
The distribution is based on data from 23 Wyoming counties.
WY Value
(64.7)
The regional value is compared to the Wyoming State value.
Prior Value
(45.0)
Prior Value compares a measured value with the previously measured value. Confidence intervals were not taken into account in determining the direction of the comparison.
Trend
This comparison measures the indicator’s values over multiple time periods.<br>The Mann-Kendall Test for Statistical Significance is used to evaluate the trend<br>over 4 to 10 periods of measure, subject to data availability and comparability.
County: Laramie Atrial Fibrillation: Medicare Population
County: Laramie Atrial Fibrillation: Medicare Population
11.0%
(2022)
Compared to:
WY Counties
The distribution is based on data from 23 Wyoming counties.
U.S. Counties
The distribution is based on data from 3,129 U.S. counties and county equivalents.
WY Value
(11.0%)
The regional value is compared to the Wyoming State value.
US Value
(14.0%)
The regional value is compared to the national value.
Prior Value
(11.0%)
Prior Value compares a measured value with the previously measured value. Confidence intervals were not taken into account in determining the direction of the comparison.
Trend
This comparison measures the indicator’s values over multiple time periods.<br>The Mann-Kendall Test for Statistical Significance is used to evaluate the trend<br>over 4 to 10 periods of measure, subject to data availability and comparability.
County: Laramie Cholesterol Test History
County: Laramie Cholesterol Test History
81.1%
(2021)
Compared to:
WY Counties
The distribution is based on data from 23 Wyoming counties.
U.S. Counties
The distribution is based on data from 3,074 U.S. counties and county equivalents.
US Value
(86.4%)
The regional value is compared to the national value.
County: Laramie Heart Failure: Medicare Population
County: Laramie Heart Failure: Medicare Population
8.0%
(2022)
Compared to:
WY Counties
The distribution is based on data from 23 Wyoming counties.
U.S. Counties
The distribution is based on data from 3,129 U.S. counties and county equivalents.
WY Value
(8.0%)
The regional value is compared to the Wyoming State value.
US Value
(11.0%)
The regional value is compared to the national value.
Prior Value
(8.0%)
Prior Value compares a measured value with the previously measured value. Confidence intervals were not taken into account in determining the direction of the comparison.
Trend
This comparison measures the indicator’s values over multiple time periods.<br>The Mann-Kendall Test for Statistical Significance is used to evaluate the trend<br>over 4 to 10 periods of measure, subject to data availability and comparability.
County: Laramie High Blood Pressure Prevalence
County: Laramie High Blood Pressure Prevalence
30.0%
(2021)
Compared to:
WY Counties
The distribution is based on data from 23 Wyoming counties.
U.S. Counties
The distribution is based on data from 3,074 U.S. counties and county equivalents.
US Value
(32.7%)
The regional value is compared to the national value.
HP 2030 Target
(41.9%)
County: Laramie High Cholesterol Prevalence: Past 5 Years
County: Laramie High Cholesterol Prevalence: Past 5 Years
32.2%
(2021)
Compared to:
WY Counties
The distribution is based on data from 23 Wyoming counties.
U.S. Counties
The distribution is based on data from 3,074 U.S. counties and county equivalents.
US Value
(36.4%)
The regional value is compared to the national value.
County: Laramie Hyperlipidemia: Medicare Population
County: Laramie Hyperlipidemia: Medicare Population
47.0%
(2022)
Compared to:
WY Counties
The distribution is based on data from 23 Wyoming counties.
U.S. Counties
The distribution is based on data from 3,129 U.S. counties and county equivalents.
WY Value
(40.0%)
The regional value is compared to the Wyoming State value.
US Value
(65.0%)
The regional value is compared to the national value.
Prior Value
(46.0%)
Prior Value compares a measured value with the previously measured value. Confidence intervals were not taken into account in determining the direction of the comparison.
Trend
This comparison measures the indicator’s values over multiple time periods.<br>The Mann-Kendall Test for Statistical Significance is used to evaluate the trend<br>over 4 to 10 periods of measure, subject to data availability and comparability.
County: Laramie Hypertension: Medicare Population
County: Laramie Hypertension: Medicare Population
55.0%
(2022)
Compared to:
WY Counties
The distribution is based on data from 23 Wyoming counties.
U.S. Counties
The distribution is based on data from 3,129 U.S. counties and county equivalents.
WY Value
(51.0%)
The regional value is compared to the Wyoming State value.
US Value
(65.0%)
The regional value is compared to the national value.
Prior Value
(56.0%)
Prior Value compares a measured value with the previously measured value. Confidence intervals were not taken into account in determining the direction of the comparison.
Trend
This comparison measures the indicator’s values over multiple time periods.<br>The Mann-Kendall Test for Statistical Significance is used to evaluate the trend<br>over 4 to 10 periods of measure, subject to data availability and comparability.
County: Laramie Ischemic Heart Disease: Medicare Population
County: Laramie Ischemic Heart Disease: Medicare Population
14.0%
(2022)
Compared to:
WY Counties
The distribution is based on data from 23 Wyoming counties.
U.S. Counties
The distribution is based on data from 3,129 U.S. counties and county equivalents.
WY Value
(14.0%)
The regional value is compared to the Wyoming State value.
US Value
(21.0%)
The regional value is compared to the national value.
Prior Value
(15.0%)
Prior Value compares a measured value with the previously measured value. Confidence intervals were not taken into account in determining the direction of the comparison.
Trend
This comparison measures the indicator’s values over multiple time periods.<br>The Mann-Kendall Test for Statistical Significance is used to evaluate the trend<br>over 4 to 10 periods of measure, subject to data availability and comparability.
County: Laramie Stroke: Medicare Population
County: Laramie Stroke: Medicare Population
3.0%
(2022)
Compared to:
WY Counties
The distribution is based on data from 23 Wyoming counties.
U.S. Counties
The distribution is based on data from 3,129 U.S. counties and county equivalents.
WY Value
(3.0%)
The regional value is compared to the Wyoming State value.
US Value
(6.0%)
The regional value is compared to the national value.
Prior Value
(4.0%)
Prior Value compares a measured value with the previously measured value. Confidence intervals were not taken into account in determining the direction of the comparison.
Trend
This comparison measures the indicator’s values over multiple time periods.<br>The Mann-Kendall Test for Statistical Significance is used to evaluate the trend<br>over 4 to 10 periods of measure, subject to data availability and comparability.
County: Laramie
Health / Immunizations & Infectious Diseases
Value
Compared to:
County: Laramie Age-Adjusted Death Rate due to Influenza and Pneumonia
County: Laramie Age-Adjusted Death Rate due to Influenza and Pneumonia
14.3
Deaths per 100,000 population
(2018-2020)
Compared to:
U.S. Counties
The distribution is based on data from 1,449 U.S. counties and county equivalents.
WY Value
(15.0)
The regional value is compared to the Wyoming State value.
US Value
(13.4)
The regional value is compared to the national value.
Prior Value
(14.0)
Prior Value compares a measured value with the previously measured value. Confidence intervals were taken into account in determining the direction of the comparison.
Trend
This comparison measures the indicator’s values over multiple time periods.<br>The Mann-Kendall Test for Statistical Significance is used to evaluate the trend<br>over 4 to 10 periods of measure, subject to data availability and comparability.
County: Laramie COVID-19 Daily Average Case-Fatality Rate
County: Laramie COVID-19 Daily Average Case-Fatality Rate
3.1
Deaths per 100 cases
(Mar 3, 2023)
Compared to:
WY Counties
(Jan 7, 2022)
The distribution is based on data from 23 Wyoming counties.
U.S. Counties
(Mar 25, 2022)
The distribution is based on data from 2,811 U.S. counties and county equivalents.
WY Value
(0.5)
The regional value is compared to the Wyoming State value.
US Value
(1.7)
The regional value is compared to the national value.
Prior Value
(0.0)
Prior Value compares a measured value with the previously measured value. Confidence intervals were not taken into account in determining the direction of the comparison.
Trend
This comparison measures the indicator’s values over multiple time periods.<br>The Mann-Kendall Test for Statistical Significance is used to evaluate the trend<br>over 4 to 10 periods of measure, subject to data availability and comparability.
County: Laramie COVID-19 Daily Average Incidence Rate
County: Laramie COVID-19 Daily Average Incidence Rate
9.11
Cases per 100,000 population
(Mar 3, 2023)
Compared to:
WY Counties
The distribution is based on data from 23 Wyoming counties.
U.S. Counties
The distribution is based on data from 3,142 U.S. counties and county equivalents.
WY Value
(7.49)
The regional value is compared to the Wyoming State value.
US Value
(10.97)
The regional value is compared to the national value.
Prior Value
(5.61)
Prior Value compares a measured value with the previously measured value. Confidence intervals were not taken into account in determining the direction of the comparison.
Trend
This comparison measures the indicator’s values over multiple time periods.<br>The Mann-Kendall Test for Statistical Significance is used to evaluate the trend<br>over 4 to 10 periods of measure, subject to data availability and comparability.
County: Laramie Flu Vaccinations: Medicare Population
County: Laramie Flu Vaccinations: Medicare Population
44.0%
(2022)
Compared to:
WY Counties
The distribution is based on data from 23 Wyoming counties.
U.S. Counties
The distribution is based on data from 3,129 U.S. counties and county equivalents.
WY Value
(40.0%)
The regional value is compared to the Wyoming State value.
US Value
(50.0%)
The regional value is compared to the national value.
Prior Value
(45.0%)
Prior Value compares a measured value with the previously measured value. Confidence intervals were not taken into account in determining the direction of the comparison.
Trend
This comparison measures the indicator’s values over multiple time periods.<br>The Mann-Kendall Test for Statistical Significance is used to evaluate the trend<br>over 4 to 10 periods of measure, subject to data availability and comparability.
County: Laramie Persons Fully Vaccinated Against COVID-19
County: Laramie Persons Fully Vaccinated Against COVID-19
59.3%
(May 10, 2023)
Compared to:
WY Counties
The distribution is based on data from 23 Wyoming counties.
U.S. Counties
The distribution is based on data from 3,125 U.S. counties and county equivalents.
Prior Value
(59.3%)
Prior Value compares a measured value with the previously measured value. Confidence intervals were not taken into account in determining the direction of the comparison.
Trend
This comparison measures the indicator’s values over multiple time periods.<br>The Mann-Kendall Test for Statistical Significance is used to evaluate the trend<br>over 4 to 10 periods of measure, subject to data availability and comparability.
County: Laramie Pneumonia Vaccinations: Medicare Population
County: Laramie Pneumonia Vaccinations: Medicare Population
7.0%
(2022)
Compared to:

WY Counties
The distribution is based on data from 23 Wyoming counties.
U.S. Counties
The distribution is based on data from 3,129 U.S. counties and county equivalents.
WY Value
(6.0%)
The regional value is compared to the Wyoming State value.
US Value
(8.0%)
The regional value is compared to the national value.
Prior Value
(5.0%)
Prior Value compares a measured value with the previously measured value. Confidence intervals were not taken into account in determining the direction of the comparison.
Trend
This comparison measures the indicator’s values over multiple time periods.<br>The Mann-Kendall Test for Statistical Significance is used to evaluate the trend<br>over 4 to 10 periods of measure, subject to data availability and comparability.
County: Laramie
Health / Maternal, Fetal & Infant Health
Value
Compared to:
County: Laramie Babies with Low Birthweight
County: Laramie Babies with Low Birthweight
9.6%
(2021)
Compared to:
WY Counties
The distribution is based on data from 20 Wyoming counties.
WY Value
(9.4%)
The regional value is compared to the Wyoming State value.
US Value
(8.5%)
The regional value is compared to the national value. The source for the national value is Centers for Disease Control and Prevention
Prior Value
(11.3%)
Prior Value compares a measured value with the previously measured value. Confidence intervals were not taken into account in determining the direction of the comparison.
Trend
This comparison measures the indicator’s values over multiple time periods.<br>The Mann-Kendall Test for Statistical Significance is used to evaluate the trend<br>over 4 to 10 periods of measure, subject to data availability and comparability.
County: Laramie Infant Mortality Rate
County: Laramie Infant Mortality Rate
5.7
Deaths per 1,000 live births
(2016-2020)
Compared to:
Prior Value
(5.5)
Prior Value compares a measured value with the previously measured value. Confidence intervals were not taken into account in determining the direction of the comparison.
Trend
This comparison measures the indicator’s values over multiple time periods.<br>The Mann-Kendall Test for Statistical Significance is used to evaluate the trend<br>over 4 to 10 periods of measure, subject to data availability and comparability.
HP 2030 Target
(5.0)
<div>MICH-02: Reduce the rate of infant deaths <strong>(LEADING HEALTH INDICATOR)</strong></div>
County: Laramie Mothers who Received Less than Adequate Prenatal Care
County: Laramie Mothers who Received Less than Adequate Prenatal Care
19.6%
(2022)
Compared to:
Prior Value
(21.9%)
Prior Value compares a measured value with the previously measured value. Confidence intervals were not taken into account in determining the direction of the comparison.
Trend
This comparison measures the indicator’s values over multiple time periods.<br>The Mann-Kendall Test for Statistical Significance is used to evaluate the trend<br>over 4 to 10 periods of measure, subject to data availability and comparability.
County: Laramie Mothers who Smoked During Pregnancy
County: Laramie Mothers who Smoked During Pregnancy
8.0%
(2022)
Compared to:
Prior Value
(7.2%)
Prior Value compares a measured value with the previously measured value. Confidence intervals were not taken into account in determining the direction of the comparison.
Trend
This comparison measures the indicator’s values over multiple time periods.<br>The Mann-Kendall Test for Statistical Significance is used to evaluate the trend<br>over 4 to 10 periods of measure, subject to data availability and comparability.
HP 2030 Target
(4.3%)
County: Laramie
Health / Mental Health & Mental Disorders
Value
Compared to:
County: Laramie Adults Ever Diagnosed with Depression
County: Laramie Adults Ever Diagnosed with Depression
20.2%
(2021)
Compared to:
WY Counties
The distribution is based on data from 23 Wyoming counties.
U.S. Counties
The distribution is based on data from 3,074 U.S. counties and county equivalents.
US Value
(19.5%)
The regional value is compared to the national value.
County: Laramie Age-Adjusted Death Rate due to Suicide
County: Laramie Age-Adjusted Death Rate due to Suicide
30.8
Deaths per 100,000 population
(2018-2020)
Compared to:
U.S. Counties
The distribution is based on data from 1,307 U.S. counties and county equivalents.
WY Value
(28.3)
The regional value is compared to the Wyoming State value.
US Value
(13.9)
The regional value is compared to the national value.
Prior Value
(30.0)
Prior Value compares a measured value with the previously measured value. Confidence intervals were taken into account in determining the direction of the comparison.
Trend
This comparison measures the indicator’s values over multiple time periods.<br>The Mann-Kendall Test for Statistical Significance is used to evaluate the trend<br>over 4 to 10 periods of measure, subject to data availability and comparability.
HP 2030 Target
(12.8)
<div>MHMD-01: Reduce the suicide rate <strong>(LEADING HEALTH INDICATOR)</strong></div>
County: Laramie Depression: Medicare Population
County: Laramie Depression: Medicare Population
14.0%
(2022)
Compared to:
WY Counties
The distribution is based on data from 23 Wyoming counties.
U.S. Counties
The distribution is based on data from 3,129 U.S. counties and county equivalents.
WY Value
(12.0%)
The regional value is compared to the Wyoming State value.
US Value
(16.0%)
The regional value is compared to the national value.
Prior Value
(14.0%)
Prior Value compares a measured value with the previously measured value. Confidence intervals were not taken into account in determining the direction of the comparison.
Trend
This comparison measures the indicator’s values over multiple time periods.<br>The Mann-Kendall Test for Statistical Significance is used to evaluate the trend<br>over 4 to 10 periods of measure, subject to data availability and comparability.
County: Laramie Mental Health Provider Rate
County: Laramie Mental Health Provider Rate
441
Providers per 100,000 population
(2022)
Compared to:
WY Counties
The distribution is based on data from 23 Wyoming counties.
U.S. Counties
The distribution is based on data from 2,941 U.S. counties and county equivalents.
WY Value
(371)
The regional value is compared to the Wyoming State value.
Prior Value
(444)
Prior Value compares a measured value with the previously measured value. Confidence intervals were not taken into account in determining the direction of the comparison.
Trend
This comparison measures the indicator’s values over multiple time periods.<br>The Mann-Kendall Test for Statistical Significance is used to evaluate the trend<br>over 4 to 10 periods of measure, subject to data availability and comparability.
County: Laramie Poor Mental Health: 14+ Days
County: Laramie Poor Mental Health: 14+ Days
14.0%
(2021)
Compared to:
WY Counties
The distribution is based on data from 23 Wyoming counties.
U.S. Counties
The distribution is based on data from 3,074 U.S. counties and county equivalents.
US Value
(14.7%)
The regional value is compared to the national value.
County: Laramie
Health / Mortality Data
Value
Compared to:
County: Laramie Life Expectancy
County: Laramie Life Expectancy
78.0
Years
(2018-2020)
Compared to:
WY Counties
The distribution is based on data from 23 Wyoming counties.
U.S. Counties
The distribution is based on data from 3,072 U.S. counties and county equivalents.
WY Value
(78.1)
The regional value is compared to the Wyoming State value.
US Value
(78.5)
The regional value is compared to the national value.
Prior Value
(78.4)
Prior Value compares a measured value with the previously measured value. Confidence intervals were taken into account in determining the direction of the comparison.
Trend
This comparison measures the indicator’s values over multiple time periods.<br>The Mann-Kendall Test for Statistical Significance is used to evaluate the trend<br>over 4 to 10 periods of measure, subject to data availability and comparability.
County: Laramie
Health / Nutrition & Healthy Eating
Value
Compared to:
County: Laramie Adult Fruit and Vegetable Consumption
County: Laramie Adult Fruit and Vegetable Consumption
12.6%
(2017-2021)
Compared to:
WY Counties
The distribution is based on data from 23 Wyoming counties.
WY Value
(10.1%)
The regional value is compared to the Wyoming State value.
Prior Value
(13.7%)
Prior Value compares a measured value with the previously measured value. Confidence intervals were taken into account in determining the direction of the comparison.
County: Laramie
Health / Older Adults
Value
Compared to:
County: Laramie Adults 65+ who Received Recommended Preventive Services: Females
County: Laramie Adults 65+ who Received Recommended Preventive Services: Females
39.3%
(2020)
Compared to:
WY Counties
The distribution is based on data from 23 Wyoming counties.
U.S. Counties
The distribution is based on data from 3,141 U.S. counties and county equivalents.
US Value
(37.9%)
The regional value is compared to the national value.
County: Laramie Adults 65+ who Received Recommended Preventive Services: Males
County: Laramie Adults 65+ who Received Recommended Preventive Services: Males
46.7%
(2020)
Compared to:
WY Counties
The distribution is based on data from 23 Wyoming counties.
U.S. Counties
The distribution is based on data from 3,141 U.S. counties and county equivalents.
US Value
(43.7%)
The regional value is compared to the national value.
County: Laramie Adults 65+ with a Disability
County: Laramie Adults 65+ with a Disability
37.1%
(2022)
Compared to:
WY Value
(34.4%)
The regional value is compared to the Wyoming State value.
Prior Value
(39.0%)
Prior Value compares a measured value with the previously measured value. Confidence intervals were taken into account in determining the direction of the comparison.
Trend
This comparison measures the indicator’s values over multiple time periods.<br>The Mann-Kendall Test for Statistical Significance is used to evaluate the trend<br>over 4 to 10 periods of measure, subject to data availability and comparability.
County: Laramie Adults 65+ with a Hearing Difficulty
County: Laramie Adults 65+ with a Hearing Difficulty
21.5%
(2018-2022)
Compared to:
WY Value
(18.1%)
The regional value is compared to the Wyoming State value.
US Value
(13.7%)
The regional value is compared to the national value.
Trend
This comparison measures the indicator’s values over multiple time periods.<br>The Mann-Kendall Test for Statistical Significance is used to evaluate the trend<br>over 4 to 10 periods of measure, subject to data availability and comparability.
County: Laramie Adults 65+ with a Self-Care Difficulty
County: Laramie Adults 65+ with a Self-Care Difficulty
5.5%
(2018-2022)
Compared to:

WY Value
(4.8%)
The regional value is compared to the Wyoming State value.
US Value
(7.4%)
The regional value is compared to the national value.
Trend
This comparison measures the indicator’s values over multiple time periods.<br>The Mann-Kendall Test for Statistical Significance is used to evaluate the trend<br>over 4 to 10 periods of measure, subject to data availability and comparability.
County: Laramie Adults 65+ with a Vision Difficulty
County: Laramie Adults 65+ with a Vision Difficulty
5.5%
(2018-2022)
Compared to:
WY Value
(6.2%)
The regional value is compared to the Wyoming State value.
US Value
(6.0%)
The regional value is compared to the national value.
Trend
This comparison measures the indicator’s values over multiple time periods.<br>The Mann-Kendall Test for Statistical Significance is used to evaluate the trend<br>over 4 to 10 periods of measure, subject to data availability and comparability.
County: Laramie Adults 65+ with an Independent Living Difficulty
County: Laramie Adults 65+ with an Independent Living Difficulty
11.3%
(2018-2022)
Compared to:
WY Value
(9.6%)
The regional value is compared to the Wyoming State value.
US Value
(13.6%)
The regional value is compared to the national value.
Trend
This comparison measures the indicator’s values over multiple time periods.<br>The Mann-Kendall Test for Statistical Significance is used to evaluate the trend<br>over 4 to 10 periods of measure, subject to data availability and comparability.
County: Laramie Alzheimer's Disease or Dementia: Medicare Population
County: Laramie Alzheimer's Disease or Dementia: Medicare Population
5.0%
(2022)
Compared to:
WY Counties
The distribution is based on data from 23 Wyoming counties.
U.S. Counties
The distribution is based on data from 3,129 U.S. counties and county equivalents.
WY Value
(4.0%)
The regional value is compared to the Wyoming State value.
US Value
(6.0%)
The regional value is compared to the national value.
Prior Value
(5.0%)
Prior Value compares a measured value with the previously measured value. Confidence intervals were not taken into account in determining the direction of the comparison.
Trend
This comparison measures the indicator’s values over multiple time periods.<br>The Mann-Kendall Test for Statistical Significance is used to evaluate the trend<br>over 4 to 10 periods of measure, subject to data availability and comparability.
County: Laramie
Health / Oral Health
Value
Compared to:
County: Laramie Dentist Rate
County: Laramie Dentist Rate
88
Dentists per 100,000 population
(2021)
Compared to:
WY Counties
The distribution is based on data from 23 Wyoming counties.
U.S. Counties
The distribution is based on data from 3,056 U.S. counties and county equivalents.
WY Value
(71)
The regional value is compared to the Wyoming State value.
Prior Value
(85)
Prior Value compares a measured value with the previously measured value. Confidence intervals were not taken into account in determining the direction of the comparison.
Trend
This comparison measures the indicator’s values over multiple time periods.<br>The Mann-Kendall Test for Statistical Significance is used to evaluate the trend<br>over 4 to 10 periods of measure, subject to data availability and comparability.
County: Laramie
Health / Other Conditions
Value
Compared to:
County: Laramie Adults with Arthritis
County: Laramie Adults with Arthritis
24.4%
(2021)
Compared to:
WY Counties
The distribution is based on data from 23 Wyoming counties.
U.S. Counties
The distribution is based on data from 3,074 U.S. counties and county equivalents.
US Value
(25.2%)
The regional value is compared to the national value.
County: Laramie Adults with Kidney Disease
County: Laramie Adults with Kidney Disease
2.8%
(2021)
Compared to:
WY Counties
The distribution is based on data from 23 Wyoming counties.
U.S. Counties
The distribution is based on data from 3,074 U.S. counties and county equivalents.
US Value
(3.1%)
The regional value is compared to the national value.
County: Laramie Age-Adjusted Death Rate due to Kidney Disease
County: Laramie Age-Adjusted Death Rate due to Kidney Disease
10.9
Deaths per 100,000 population
(2018-2020)
Compared to:
U.S. Counties
The distribution is based on data from 1,416 U.S. counties and county equivalents.
WY Value
(8.3)
The regional value is compared to the Wyoming State value.
US Value
(12.8)
The regional value is compared to the national value.
Prior Value
(11.8)
Prior Value compares a measured value with the previously measured value. Confidence intervals were taken into account in determining the direction of the comparison.
Trend
This comparison measures the indicator’s values over multiple time periods.<br>The Mann-Kendall Test for Statistical Significance is used to evaluate the trend<br>over 4 to 10 periods of measure, subject to data availability and comparability.
County: Laramie Chronic Kidney Disease: Medicare Population
County: Laramie Chronic Kidney Disease: Medicare Population
10.0%
(2022)
Compared to:
WY Counties
The distribution is based on data from 23 Wyoming counties.
U.S. Counties
The distribution is based on data from 3,129 U.S. counties and county equivalents.
WY Value
(9.0%)
The regional value is compared to the Wyoming State value.
US Value
(18.0%)
The regional value is compared to the national value.
Prior Value
(10.0%)
Prior Value compares a measured value with the previously measured value. Confidence intervals were not taken into account in determining the direction of the comparison.
Trend
This comparison measures the indicator’s values over multiple time periods.<br>The Mann-Kendall Test for Statistical Significance is used to evaluate the trend<br>over 4 to 10 periods of measure, subject to data availability and comparability.
County: Laramie Osteoporosis: Medicare Population
County: Laramie Osteoporosis: Medicare Population
7.0%
(2022)
Compared to:
WY Counties
The distribution is based on data from 23 Wyoming counties.
U.S. Counties
The distribution is based on data from 3,129 U.S. counties and county equivalents.
WY Value
(8.0%)
The regional value is compared to the Wyoming State value.
US Value
(11.0%)
The regional value is compared to the national value.
Prior Value
(7.0%)
Prior Value compares a measured value with the previously measured value. Confidence intervals were not taken into account in determining the direction of the comparison.
Trend
This comparison measures the indicator’s values over multiple time periods.<br>The Mann-Kendall Test for Statistical Significance is used to evaluate the trend<br>over 4 to 10 periods of measure, subject to data availability and comparability.
County: Laramie Rheumatoid Arthritis or Osteoarthritis: Medicare Population
County: Laramie Rheumatoid Arthritis or Osteoarthritis: Medicare Population
29.0%
(2022)
Compared to:
WY Counties
The distribution is based on data from 23 Wyoming counties.
U.S. Counties
The distribution is based on data from 3,129 U.S. counties and county equivalents.
WY Value
(27.0%)
The regional value is compared to the Wyoming State value.
US Value
(35.0%)
The regional value is compared to the national value.
Prior Value
(28.0%)
Prior Value compares a measured value with the previously measured value. Confidence intervals were not taken into account in determining the direction of the comparison.
Trend
This comparison measures the indicator’s values over multiple time periods.<br>The Mann-Kendall Test for Statistical Significance is used to evaluate the trend<br>over 4 to 10 periods of measure, subject to data availability and comparability.
County: Laramie
Health / Physical Activity
Value
Compared to:
County: Laramie Adults who are Sedentary
County: Laramie Adults who are Sedentary
23.4%
(2017-2021)
Compared to:
WY Counties
The distribution is based on data from 23 Wyoming counties.
WY Value
(22.8%)
The regional value is compared to the Wyoming State value.
Prior Value
(23.1%)
Prior Value compares a measured value with the previously measured value. Confidence intervals were taken into account in determining the direction of the comparison.
HP 2030 Target
(21.8%)
County: Laramie
Health / Prevention & Safety
Value
Compared to:
County: Laramie Age-Adjusted Death Rate due to Firearms
County: Laramie Age-Adjusted Death Rate due to Firearms
25.4
Deaths per 100,000 population
(2018-2020)
Compared to:
U.S. Counties
The distribution is based on data from 1,083 U.S. counties and county equivalents.
WY Value
(22.4)
The regional value is compared to the Wyoming State value.
US Value
(12.0)
The regional value is compared to the national value.
Prior Value
(24.4)
Prior Value compares a measured value with the previously measured value. Confidence intervals were taken into account in determining the direction of the comparison.
Trend
This comparison measures the indicator’s values over multiple time periods.<br>The Mann-Kendall Test for Statistical Significance is used to evaluate the trend<br>over 4 to 10 periods of measure, subject to data availability and comparability.
HP 2030 Target
(10.7)
County: Laramie
Health / Respiratory Diseases
Value
Compared to:
County: Laramie Adults with COPD
County: Laramie Adults with COPD
6.8%
Percent of adults
(2021)
Compared to:
WY Counties
The distribution is based on data from 23 Wyoming counties.
U.S. Counties
The distribution is based on data from 3,074 U.S. counties and county equivalents.
US Value
(6.4%)
The regional value is compared to the national value.
County: Laramie Asthma: Medicare Population
County: Laramie Asthma: Medicare Population
6.0%
(2022)
Compared to:
WY Counties
The distribution is based on data from 23 Wyoming counties.
U.S. Counties
The distribution is based on data from 3,129 U.S. counties and county equivalents.
WY Value
(5.0%)
The regional value is compared to the Wyoming State value.
US Value
(7.0%)
The regional value is compared to the national value.
Prior Value
(6.0%)
Prior Value compares a measured value with the previously measured value. Confidence intervals were not taken into account in determining the direction of the comparison.
Trend
This comparison measures the indicator’s values over multiple time periods.<br>The Mann-Kendall Test for Statistical Significance is used to evaluate the trend<br>over 4 to 10 periods of measure, subject to data availability and comparability.
County: Laramie COPD: Medicare Population
County: Laramie COPD: Medicare Population
11.0%
(2022)
Compared to:
WY Counties
The distribution is based on data from 23 Wyoming counties.
U.S. Counties
The distribution is based on data from 3,129 U.S. counties and county equivalents.
WY Value
(10.0%)
The regional value is compared to the Wyoming State value.
US Value
(11.0%)
The regional value is compared to the national value.
Prior Value
(12.0%)
Prior Value compares a measured value with the previously measured value. Confidence intervals were not taken into account in determining the direction of the comparison.
Trend
This comparison measures the indicator’s values over multiple time periods.<br>The Mann-Kendall Test for Statistical Significance is used to evaluate the trend<br>over 4 to 10 periods of measure, subject to data availability and comparability.
County: Laramie
Health / Sexually Transmitted Infections
Value
Compared to:
County: Laramie Chlamydia Incidence Rate
County: Laramie Chlamydia Incidence Rate
414.4
Cases per 100,000 population
(2021)
Compared to:
WY Counties
The distribution is based on data from 23 Wyoming counties.
U.S. Counties
The distribution is based on data from 2,800 U.S. counties and county equivalents.
WY Value
(359.0)
The regional value is compared to the Wyoming State value.
US Value
(495.5)
The regional value is compared to the national value.
Prior Value
(352.8)
Prior Value compares a measured value with the previously measured value. Confidence intervals were not taken into account in determining the direction of the comparison.
Trend
This comparison measures the indicator’s values over multiple time periods.<br>The Mann-Kendall Test for Statistical Significance is used to evaluate the trend<br>over 4 to 10 periods of measure, subject to data availability and comparability.
County: Laramie Gonorrhea Incidence Rate
County: Laramie Gonorrhea Incidence Rate
136.8
Cases per 100,000 population
(2021)
Compared to:
WY Counties
The distribution is based on data from 23 Wyoming counties.
U.S. Counties
The distribution is based on data from 3,117 U.S. counties and county equivalents.
WY Value
(90.4)
The regional value is compared to the Wyoming State value.
US Value
(214.0)
The regional value is compared to the national value.
Prior Value
(147.7)
Prior Value compares a measured value with the previously measured value. Confidence intervals were not taken into account in determining the direction of the comparison.
Trend
This comparison measures the indicator’s values over multiple time periods.<br>The Mann-Kendall Test for Statistical Significance is used to evaluate the trend<br>over 4 to 10 periods of measure, subject to data availability and comparability.
County: Laramie
Health / Tobacco Use
Value
Compared to:
County: Laramie Adults who Smoke
County: Laramie Adults who Smoke
18.3%
(2017-2021)
Compared to:
WY Counties
The distribution is based on data from 23 Wyoming counties.
WY Value
(16.4%)
The regional value is compared to the Wyoming State value.
Prior Value
(20.4%)
Prior Value compares a measured value with the previously measured value. Confidence intervals were taken into account in determining the direction of the comparison.
HP 2030 Target
(6.1%)
<div>TU-02: Reduce current cigarette smoking in adults <strong>(LEADING HEALTH INDICATOR)</strong></div>
County: Laramie
Health / Weight Status
Value
Compared to:
County: Laramie Adults Who Are Obese
County: Laramie Adults Who Are Obese
30.1%
(2017-2021)
Compared to:
WY Counties
The distribution is based on data from 23 Wyoming counties.
WY Value
(32.0%)
The regional value is compared to the Wyoming State value.
Prior Value
(30.1%)
Prior Value compares a measured value with the previously measured value. Confidence intervals were taken into account in determining the direction of the comparison.
County: Laramie Adults who are Overweight or Obese
County: Laramie Adults who are Overweight or Obese
65.7%
(2017-2021)
Compared to:
WY Counties
The distribution is based on data from 23 Wyoming counties.
WY Value
(68.9%)
The regional value is compared to the Wyoming State value.
Prior Value
(67.0%)
Prior Value compares a measured value with the previously measured value. Confidence intervals were taken into account in determining the direction of the comparison.
County: Laramie
Health / Wellness & Lifestyle
Value
Compared to:
County: Laramie Insufficient Sleep
County: Laramie Insufficient Sleep
30.4%
(2020)
Compared to:
WY Counties
The distribution is based on data from 23 Wyoming counties.
U.S. Counties
The distribution is based on data from 3,140 U.S. counties and county equivalents.
WY Value
(33.1%)
The regional value is compared to the Wyoming State value.
US Value
(33.0%)
The regional value is compared to the national value.
Prior Value
(35.3%)
Prior Value compares a measured value with the previously measured value. Confidence intervals were not taken into account in determining the direction of the comparison.
HP 2030 Target
(26.7%)
County: Laramie Poor Physical Health: 14+ Days
County: Laramie Poor Physical Health: 14+ Days
10.4%
(2021)
Compared to:
WY Counties
The distribution is based on data from 23 Wyoming counties.
U.S. Counties
The distribution is based on data from 3,074 U.S. counties and county equivalents.
US Value
(10.9%)
The regional value is compared to the national value.
County: Laramie Self-Reported General Health Assessment: Poor or Fair
County: Laramie Self-Reported General Health Assessment: Poor or Fair
13.9%
(2021)
Compared to:
WY Counties
The distribution is based on data from 23 Wyoming counties.
U.S. Counties
The distribution is based on data from 3,074 U.S. counties and county equivalents.
US Value
(16.1%)
The regional value is compared to the national value.
County: Laramie
Community / Civic Engagement
Value
Compared to:
County: Laramie Voter Turnout: Presidential Election
County: Laramie Voter Turnout: Presidential Election
104.4%
(2020)
Compared to:
WY Counties
The distribution is based on data from 23 Wyoming counties.
WY Value
(103.6%)
The regional value is compared to the Wyoming State value.
Prior Value
(93.7%)
Prior Value compares a measured value with the previously measured value. Confidence intervals were not taken into account in determining the direction of the comparison.
Trend
This comparison measures the indicator’s values over multiple time periods.<br>The Mann-Kendall Test for Statistical Significance is used to evaluate the trend<br>over 4 to 10 periods of measure, subject to data availability and comparability.
HP 2030 Target
(58.4%)
<div>SDOH-07: Increase the proportion of the voting-age citizens who vote</div>
County: Laramie
Community / Crime & Crime Prevention
Value
Compared to:
County: Laramie Violent Crime Rate
County: Laramie Violent Crime Rate
327.3
Crimes per 100,000 population
(2022)
Compared to:
WY Counties
The distribution is based on data from 21 Wyoming counties.
WY Value
(156.2)
The regional value is compared to the Wyoming State value.
US Value
(379.4 in 2019)
The regional value is compared to the national value. The source for the national value is Federal Bureau of Investigation
Prior Value
(293.5)
Prior Value compares a measured value with the previously measured value. Confidence intervals were not taken into account in determining the direction of the comparison.
Trend
This comparison measures the indicator’s values over multiple time periods.<br>The Mann-Kendall Test for Statistical Significance is used to evaluate the trend<br>over 4 to 10 periods of measure, subject to data availability and comparability.
County: Laramie
Community / Demographics
Value
Compared to:
County: Laramie Average Household Size
County: Laramie Average Household Size
2.40
Persons per household
(2018-2022)
Compared to:
WY Value
(2.40)
The regional value is compared to the Wyoming State value.
US Value
(2.60)
The regional value is compared to the national value.
Trend
This comparison measures the indicator’s values over multiple time periods.<br>The Mann-Kendall Test for Statistical Significance is used to evaluate the trend<br>over 4 to 10 periods of measure, subject to data availability and comparability.
County: Laramie Female Population
County: Laramie Female Population
49.0%
(2022)
Compared to:

WY Value
(48.8%)
The regional value is compared to the Wyoming State value.
US Value
(50.4%)
The regional value is compared to the national value.
Prior Value
(49.1%)
Prior Value compares a measured value with the previously measured value. Confidence intervals were not taken into account in determining the direction of the comparison.
Trend
This comparison measures the indicator’s values over multiple time periods.<br>The Mann-Kendall Test for Statistical Significance is used to evaluate the trend<br>over 4 to 10 periods of measure, subject to data availability and comparability.
County: Laramie Foreign Born Persons
County: Laramie Foreign Born Persons
3.3%
(2018-2022)
Compared to:
WY Value
(3.4%)
The regional value is compared to the Wyoming State value.
US Value
(13.7%)
The regional value is compared to the national value.
Trend
This comparison measures the indicator’s values over multiple time periods.<br>The Mann-Kendall Test for Statistical Significance is used to evaluate the trend<br>over 4 to 10 periods of measure, subject to data availability and comparability.
County: Laramie Households
County: Laramie Households
41,407
Households
(2018-2022)
Compared to:
Trend
This comparison measures the indicator’s values over multiple time periods.<br>The Mann-Kendall Test for Statistical Significance is used to evaluate the trend<br>over 4 to 10 periods of measure, subject to data availability and comparability.
County: Laramie Male Population
County: Laramie Male Population
51.0%
(2022)
Compared to:
WY Value
(51.2%)
The regional value is compared to the Wyoming State value.
US Value
(49.6%)
The regional value is compared to the national value.
Prior Value
(50.9%)
Prior Value compares a measured value with the previously measured value. Confidence intervals were not taken into account in determining the direction of the comparison.
Trend
This comparison measures the indicator’s values over multiple time periods.<br>The Mann-Kendall Test for Statistical Significance is used to evaluate the trend<br>over 4 to 10 periods of measure, subject to data availability and comparability.
6.1%
(2018-2022)
Compared to:
WY Value
(6.8%)
The regional value is compared to the Wyoming State value.
US Value
(21.7%)
The regional value is compared to the national value.
County: Laramie Population American Indian and Alaska Native
County: Laramie Population American Indian and Alaska Native
1.3%
(2022)
Compared to:
WY Value
(2.8%)
The regional value is compared to the Wyoming State value.
US Value
(1.3%)
The regional value is compared to the national value.
Prior Value
(1.3%)
Prior Value compares a measured value with the previously measured value. Confidence intervals were not taken into account in determining the direction of the comparison.
Trend
This comparison measures the indicator’s values over multiple time periods.<br>The Mann-Kendall Test for Statistical Significance is used to evaluate the trend<br>over 4 to 10 periods of measure, subject to data availability and comparability.
County: Laramie Population Asian
County: Laramie Population Asian
1.4%
(2022)
Compared to:
WY Value
(1.1%)
The regional value is compared to the Wyoming State value.
US Value
(6.3%)
The regional value is compared to the national value.
Prior Value
(1.3%)
Prior Value compares a measured value with the previously measured value. Confidence intervals were not taken into account in determining the direction of the comparison.
Trend
This comparison measures the indicator’s values over multiple time periods.<br>The Mann-Kendall Test for Statistical Significance is used to evaluate the trend<br>over 4 to 10 periods of measure, subject to data availability and comparability.
County: Laramie Population Black or African American
County: Laramie Population Black or African American
2.5%
(2022)
Compared to:
WY Value
(1.2%)
The regional value is compared to the Wyoming State value.
US Value
(13.6%)
The regional value is compared to the national value.
Prior Value
(2.5%)
Prior Value compares a measured value with the previously measured value. Confidence intervals were not taken into account in determining the direction of the comparison.
Trend
This comparison measures the indicator’s values over multiple time periods.<br>The Mann-Kendall Test for Statistical Significance is used to evaluate the trend<br>over 4 to 10 periods of measure, subject to data availability and comparability.
County: Laramie Population Hispanic or Latino
County: Laramie Population Hispanic or Latino
15.8%
(2022)
Compared to:
WY Value
(10.8%)
The regional value is compared to the Wyoming State value.
US Value
(19.1%)
The regional value is compared to the national value.
Prior Value
(15.6%)
Prior Value compares a measured value with the previously measured value. Confidence intervals were not taken into account in determining the direction of the comparison.
Trend
This comparison measures the indicator’s values over multiple time periods.<br>The Mann-Kendall Test for Statistical Significance is used to evaluate the trend<br>over 4 to 10 periods of measure, subject to data availability and comparability.
County: Laramie Population Native Hawaiian and Other Pacific Islander
County: Laramie Population Native Hawaiian and Other Pacific Islander
0.1%
(2022)
Compared to:
WY Value
(0.1%)
The regional value is compared to the Wyoming State value.
US Value
(0.3%)
The regional value is compared to the national value.
Prior Value
(0.2%)
Prior Value compares a measured value with the previously measured value. Confidence intervals were not taken into account in determining the direction of the comparison.
Trend
This comparison measures the indicator’s values over multiple time periods.<br>The Mann-Kendall Test for Statistical Significance is used to evaluate the trend<br>over 4 to 10 periods of measure, subject to data availability and comparability.
County: Laramie Population Over Age 65
County: Laramie Population Over Age 65
17.4%
(2022)
Compared to:
WY Value
(18.6%)
The regional value is compared to the Wyoming State value.
US Value
(17.3%)
The regional value is compared to the national value.
Prior Value
(17.0%)
Prior Value compares a measured value with the previously measured value. Confidence intervals were not taken into account in determining the direction of the comparison.
Trend
This comparison measures the indicator’s values over multiple time periods.<br>The Mann-Kendall Test for Statistical Significance is used to evaluate the trend<br>over 4 to 10 periods of measure, subject to data availability and comparability.
County: Laramie Population Over Age 65 (Count)
County: Laramie Population Over Age 65 (Count)
16,631
People
(2018-2022)
Compared to:
Trend
This comparison measures the indicator’s values over multiple time periods.<br>The Mann-Kendall Test for Statistical Significance is used to evaluate the trend<br>over 4 to 10 periods of measure, subject to data availability and comparability.
County: Laramie Population Two or More Races
County: Laramie Population Two or More Races
3.2%
(2022)
Compared to:
WY Value
(2.4%)
The regional value is compared to the Wyoming State value.
US Value
(3.0%)
The regional value is compared to the national value.
Prior Value
(3.2%)
Prior Value compares a measured value with the previously measured value. Confidence intervals were not taken into account in determining the direction of the comparison.
Trend
This comparison measures the indicator’s values over multiple time periods.<br>The Mann-Kendall Test for Statistical Significance is used to evaluate the trend<br>over 4 to 10 periods of measure, subject to data availability and comparability.
County: Laramie Population Under Age 18
County: Laramie Population Under Age 18
22.3%
(2022)
Compared to:
WY Value
(22.4%)
The regional value is compared to the Wyoming State value.
US Value
(21.7%)
The regional value is compared to the national value.
Prior Value
(22.6%)
Prior Value compares a measured value with the previously measured value. Confidence intervals were not taken into account in determining the direction of the comparison.
Trend
This comparison measures the indicator’s values over multiple time periods.<br>The Mann-Kendall Test for Statistical Significance is used to evaluate the trend<br>over 4 to 10 periods of measure, subject to data availability and comparability.
County: Laramie Population Under Age 5
County: Laramie Population Under Age 5
5.6%
(2022)
Compared to:
WY Value
(5.4%)
The regional value is compared to the Wyoming State value.
US Value
(5.6%)
The regional value is compared to the national value.
Prior Value
(5.7%)
Prior Value compares a measured value with the previously measured value. Confidence intervals were not taken into account in determining the direction of the comparison.
Trend
This comparison measures the indicator’s values over multiple time periods.<br>The Mann-Kendall Test for Statistical Significance is used to evaluate the trend<br>over 4 to 10 periods of measure, subject to data availability and comparability.
County: Laramie Population White
County: Laramie Population White
91.4%
(2022)
Compared to:
WY Value
(92.3%)
The regional value is compared to the Wyoming State value.
US Value
(75.5%)
The regional value is compared to the national value.
Prior Value
(91.5%)
Prior Value compares a measured value with the previously measured value. Confidence intervals were not taken into account in determining the direction of the comparison.
Trend
This comparison measures the indicator’s values over multiple time periods.<br>The Mann-Kendall Test for Statistical Significance is used to evaluate the trend<br>over 4 to 10 periods of measure, subject to data availability and comparability.
County: Laramie Population White (Not Hispanic or Latino)
County: Laramie Population White (Not Hispanic or Latino)
77.5%
(2022)
Compared to:
WY Value
(83.1%)
The regional value is compared to the Wyoming State value.
US Value
(58.9%)
The regional value is compared to the national value.
Prior Value
(77.8%)
Prior Value compares a measured value with the previously measured value. Confidence intervals were not taken into account in determining the direction of the comparison.
Trend
This comparison measures the indicator’s values over multiple time periods.<br>The Mann-Kendall Test for Statistical Significance is used to evaluate the trend<br>over 4 to 10 periods of measure, subject to data availability and comparability.
County: Laramie Total Population
County: Laramie Total Population
100,723
People
(2022)
Compared to:
Prior Value
(100,794)
Prior Value compares a measured value with the previously measured value. Confidence intervals were not taken into account in determining the direction of the comparison.
Trend
This comparison measures the indicator’s values over multiple time periods.<br>The Mann-Kendall Test for Statistical Significance is used to evaluate the trend<br>over 4 to 10 periods of measure, subject to data availability and comparability.
County: Laramie Veteran Population
County: Laramie Veteran Population
14.4%
(2018-2022)
Compared to:
WY Value
(9.6%)
The regional value is compared to the Wyoming State value.
US Value
(6.6%)
The regional value is compared to the national value.
Trend
This comparison measures the indicator’s values over multiple time periods.<br>The Mann-Kendall Test for Statistical Significance is used to evaluate the trend<br>over 4 to 10 periods of measure, subject to data availability and comparability.
County: Laramie
Community / Domestic Violence & Abuse
Value
Compared to:
County: Laramie Domestic Violence Incidents per 1,000 Population
County: Laramie Domestic Violence Incidents per 1,000 Population
4.9
Incidents per 1,000 population
(2021)
Compared to:
WY Counties
The distribution is based on data from 20 Wyoming counties.
WY Value
(3.5)
The regional value is compared to the Wyoming State value.
Prior Value
(3.9)
Prior Value compares a measured value with the previously measured value. Confidence intervals were not taken into account in determining the direction of the comparison.
Trend
This comparison measures the indicator’s values over multiple time periods.<br>The Mann-Kendall Test for Statistical Significance is used to evaluate the trend<br>over 4 to 10 periods of measure, subject to data availability and comparability.
County: Laramie
Community / Public Safety
Value
Compared to:
County: Laramie Alcohol-Impaired Driving Deaths
County: Laramie Alcohol-Impaired Driving Deaths
33.3%
Percent of driving deaths with alcohol involvement
(2016-2020)
Compared to:
WY Counties
The distribution is based on data from 23 Wyoming counties.
U.S. Counties
The distribution is based on data from 3,115 U.S. counties and county equivalents.
WY Value
(31.8%)
The regional value is compared to the Wyoming State value.
US Value
(27.0%)
The regional value is compared to the national value.
Prior Value
(34.3%)
Prior Value compares a measured value with the previously measured value. Confidence intervals were taken into account in determining the direction of the comparison.
Trend
This comparison measures the indicator’s values over multiple time periods.<br>The Mann-Kendall Test for Statistical Significance is used to evaluate the trend<br>over 4 to 10 periods of measure, subject to data availability and comparability.
County: Laramie Death Rate due to Motor Vehicle Collisions
County: Laramie Death Rate due to Motor Vehicle Collisions
14.2
Deaths per 100,000 population
(2014-2020)
Compared to:
WY Counties
(2013-2019)
The distribution is based on data from 20 Wyoming counties.
U.S. Counties
The distribution is based on data from 2,691 U.S. counties and county equivalents.
WY Value
(18.1)
The regional value is compared to the Wyoming State value.
US Value
(12.0)
The regional value is compared to the national value.
Prior Value
(14.3)
Prior Value compares a measured value with the previously measured value. Confidence intervals were taken into account in determining the direction of the comparison.
Trend
This comparison measures the indicator’s values over multiple time periods.<br>The Mann-Kendall Test for Statistical Significance is used to evaluate the trend<br>over 4 to 10 periods of measure, subject to data availability and comparability.
County: Laramie
Community / Social Environment
Value
Compared to:
County: Laramie Child Abuse Reports
County: Laramie Child Abuse Reports
1,351.0
Reports
(2015)
Compared to:
Prior Value
(1,305.0)
Prior Value compares a measured value with the previously measured value. Confidence intervals were not taken into account in determining the direction of the comparison.
Trend
This comparison measures the indicator’s values over multiple time periods.<br>The Mann-Kendall Test for Statistical Significance is used to evaluate the trend<br>over 4 to 10 periods of measure, subject to data availability and comparability.
County: Laramie Children in Single-Parent Households
County: Laramie Children in Single-Parent Households
19.5%
(2018-2022)
Compared to:
WY Counties
The distribution is based on data from 23 Wyoming counties.
U.S. Counties
The distribution is based on data from 3,132 U.S. counties and county equivalents.
WY Value
(17.7%)
The regional value is compared to the Wyoming State value.
US Value
(24.9%)
The regional value is compared to the national value.
Trend
This comparison measures the indicator’s values over multiple time periods.<br>The Mann-Kendall Test for Statistical Significance is used to evaluate the trend<br>over 4 to 10 periods of measure, subject to data availability and comparability.
County: Laramie People 65+ Living Alone (Count)
County: Laramie People 65+ Living Alone (Count)
5,044
People
(2018-2022)
Compared to:
Trend
This comparison measures the indicator’s values over multiple time periods.<br>The Mann-Kendall Test for Statistical Significance is used to evaluate the trend<br>over 4 to 10 periods of measure, subject to data availability and comparability.
County: Laramie Social Associations
County: Laramie Social Associations
12.1
Membership associations per 10,000 population
(2020)
Compared to:
WY Counties
The distribution is based on data from 23 Wyoming counties.
U.S. Counties
The distribution is based on data from 3,142 U.S. counties and county equivalents.
WY Value
(13.7)
The regional value is compared to the Wyoming State value.
US Value
(9.1)
The regional value is compared to the national value.
Prior Value
(12.6)
Prior Value compares a measured value with the previously measured value. Confidence intervals were not taken into account in determining the direction of the comparison.
Trend
This comparison measures the indicator’s values over multiple time periods.<br>The Mann-Kendall Test for Statistical Significance is used to evaluate the trend<br>over 4 to 10 periods of measure, subject to data availability and comparability.
County: Laramie
Community / Transportation
Value
Compared to:
County: Laramie Households without a Vehicle
County: Laramie Households without a Vehicle
4.9%
(2018-2022)
Compared to:
WY Counties
The distribution is based on data from 23 Wyoming counties.
U.S. Counties
The distribution is based on data from 3,133 U.S. counties and county equivalents.
WY Value
(3.8%)
The regional value is compared to the Wyoming State value.
US Value
(8.3%)
The regional value is compared to the national value.
Trend
This comparison measures the indicator’s values over multiple time periods.<br>The Mann-Kendall Test for Statistical Significance is used to evaluate the trend<br>over 4 to 10 periods of measure, subject to data availability and comparability.
County: Laramie Mean Travel Time to Work
County: Laramie Mean Travel Time to Work
17.2
Minutes
(2018-2022)
Compared to:
WY Counties
The distribution is based on data from 23 Wyoming counties.
U.S. Counties
The distribution is based on data from 3,131 U.S. counties and county equivalents.
WY Value
(18.0)
The regional value is compared to the Wyoming State value.
US Value
(26.7)
The regional value is compared to the national value.
Trend
This comparison measures the indicator’s values over multiple time periods.<br>The Mann-Kendall Test for Statistical Significance is used to evaluate the trend<br>over 4 to 10 periods of measure, subject to data availability and comparability.
County: Laramie Solo Drivers with a Long Commute
County: Laramie Solo Drivers with a Long Commute
9.8%
(2017-2021)
Compared to:
WY Counties
The distribution is based on data from 23 Wyoming counties.
U.S. Counties
The distribution is based on data from 3,142 U.S. counties and county equivalents.
WY Value
(15.4%)
The regional value is compared to the Wyoming State value.
US Value
(37.0%)
The regional value is compared to the national value.
Prior Value
(8.9%)
Prior Value compares a measured value with the previously measured value. Confidence intervals were taken into account in determining the direction of the comparison.
Trend
This comparison measures the indicator’s values over multiple time periods.<br>The Mann-Kendall Test for Statistical Significance is used to evaluate the trend<br>over 4 to 10 periods of measure, subject to data availability and comparability.
County: Laramie Workers Commuting by Public Transportation
County: Laramie Workers Commuting by Public Transportation
0.1%
(2018-2022)
Compared to:
WY Counties
(2015-2019)
The distribution is based on data from 23 Wyoming counties.
U.S. Counties
(2015-2019)
The distribution is based on data from 3,142 U.S. counties and county equivalents.
WY Value
(0.9%)
The regional value is compared to the Wyoming State value.
US Value
(3.8%)
The regional value is compared to the national value.
Trend
This comparison measures the indicator’s values over multiple time periods.<br>The Mann-Kendall Test for Statistical Significance is used to evaluate the trend<br>over 4 to 10 periods of measure, subject to data availability and comparability.
HP 2030 Target
(5.3%)
County: Laramie Workers who Drive Alone to Work
County: Laramie Workers who Drive Alone to Work
81.1%
(2018-2022)
Compared to:
WY Counties
The distribution is based on data from 23 Wyoming counties.
U.S. Counties
The distribution is based on data from 3,133 U.S. counties and county equivalents.
WY Value
(76.4%)
The regional value is compared to the Wyoming State value.
US Value
(71.7%)
The regional value is compared to the national value.
Trend
This comparison measures the indicator’s values over multiple time periods.<br>The Mann-Kendall Test for Statistical Significance is used to evaluate the trend<br>over 4 to 10 periods of measure, subject to data availability and comparability.
County: Laramie Workers who Walk to Work
County: Laramie Workers who Walk to Work
1.1%
(2018-2022)
Compared to:
WY Counties
The distribution is based on data from 23 Wyoming counties.
U.S. Counties
The distribution is based on data from 3,133 U.S. counties and county equivalents.
WY Value
(3.5%)
The regional value is compared to the Wyoming State value.
US Value
(2.4%)
The regional value is compared to the national value.
Trend
This comparison measures the indicator’s values over multiple time periods.<br>The Mann-Kendall Test for Statistical Significance is used to evaluate the trend<br>over 4 to 10 periods of measure, subject to data availability and comparability.
