Advanced Search: Build a Custom Dashboard
In the fields below, search for indicators by location, topics, population, classification, subgroup, or comparison. No fields are required, but we suggest selecting a location or two to start. In the additional search options section, select options to group and order search results. To learn more about how to customize a dashboard, see our help center.
Visit the Indicator List Page to see the full list of indicators and locations available on the site.
Search Results:
Indicator Gauge Icon Legend
Legend Colors
Red is bad, green is good, blue is not statistically different/neutral.
Compared to Distribution
 the value is in the best half of communities.
 the value is in the 2nd worst quarter of communities.
 the value is in the worst quarter of communities.
Compared to Target
 meets target;
  does not meet target.
Compared to a Single Value
 lower than the comparison value;
 higher than the comparison value;
 not statistically different from comparison value.
Trend

 non-significant change over time;
 significant change over time;
  no change over time.
Compared to Prior Value
 higher than the previous measurement period;
 lower than the previous measurement period;
 no statistically different change from previous measurement period.
Health / Children's Health
Health / Children's Health
County: Laramie
Value
Compared to:
County: Laramie Child Abuse Reports
County: Laramie Child Abuse Reports
1,351.0
Reports
(2015)
Compared to:


Prior Value
(1,305.0)
Prior Value compares a measured value with the previously measured value. Confidence intervals were not taken into account in determining the direction of the comparison.
Trend
This comparison measures the indicator’s values over multiple time periods.<br>The Mann-Kendall Test for Statistical Significance is used to evaluate the trend<br>over 4 to 10 periods of measure, subject to data availability and comparability.
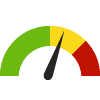
County: Laramie Child Care Centers
County: Laramie Child Care Centers
7.3
Per 1,000 population under age 5
(2022)
Compared to:


WY Counties
The distribution is based on data from 23 Wyoming counties.
WY Value
(9.7)
The regional value is compared to the Wyoming State value.
US Value
(7.0)
The regional value is compared to the national value.
Prior Value
(10.9)
Prior Value compares a measured value with the previously measured value. Confidence intervals were not taken into account in determining the direction of the comparison.
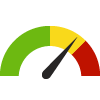
County: Laramie Child Food Insecurity Rate
County: Laramie Child Food Insecurity Rate
12.2%
(2021)
Compared to:
WY Counties
The distribution is based on data from 22 Wyoming counties.
U.S. Counties
The distribution is based on data from 3,140 U.S. counties and county equivalents.
WY Value
(12.2%)
The regional value is compared to the Wyoming State value.
US Value
(12.8%)
The regional value is compared to the national value.
Prior Value
(13.7%)
Prior Value compares a measured value with the previously measured value. Confidence intervals were not taken into account in determining the direction of the comparison.
Trend
This comparison measures the indicator’s values over multiple time periods.<br>The Mann-Kendall Test for Statistical Significance is used to evaluate the trend<br>over 4 to 10 periods of measure, subject to data availability and comparability.
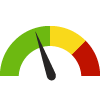
County: Laramie Children with a Disability
County: Laramie Children with a Disability
8.1%
(2022)
Compared to:


WY Value
(4.5%)
The regional value is compared to the Wyoming State value.
Prior Value
(2.1%)
Prior Value compares a measured value with the previously measured value. Confidence intervals were taken into account in determining the direction of the comparison.
Trend
This comparison measures the indicator’s values over multiple time periods.<br>The Mann-Kendall Test for Statistical Significance is used to evaluate the trend<br>over 4 to 10 periods of measure, subject to data availability and comparability.
County: Laramie Children with Health Insurance
County: Laramie Children with Health Insurance
89.3%
(2021)
Compared to:


WY Counties
The distribution is based on data from 23 Wyoming counties.
U.S. Counties
The distribution is based on data from 3,140 U.S. counties and county equivalents.
WY Value
(88.5%)
The regional value is compared to the Wyoming State value.
Prior Value
(92.9%)
Prior Value compares a measured value with the previously measured value. Confidence intervals were taken into account in determining the direction of the comparison.
Trend
This comparison measures the indicator’s values over multiple time periods.<br>The Mann-Kendall Test for Statistical Significance is used to evaluate the trend<br>over 4 to 10 periods of measure, subject to data availability and comparability.
County: Laramie Food Insecure Children Likely Ineligible for Assistance
County: Laramie Food Insecure Children Likely Ineligible for Assistance
38%
(2021)
Compared to:
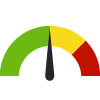

WY Counties
The distribution is based on data from 22 Wyoming counties.
U.S. Counties
The distribution is based on data from 3,134 U.S. counties and county equivalents.
WY Value
(35%)
The regional value is compared to the Wyoming State value.
US Value
(25%)
The regional value is compared to the national value.
Prior Value
(37%)
Prior Value compares a measured value with the previously measured value. Confidence intervals were not taken into account in determining the direction of the comparison.
Trend
This comparison measures the indicator’s values over multiple time periods.<br>The Mann-Kendall Test for Statistical Significance is used to evaluate the trend<br>over 4 to 10 periods of measure, subject to data availability and comparability.
County: Laramie Projected Child Food Insecurity Rate
County: Laramie Projected Child Food Insecurity Rate
15.6%
(2021)
Compared to:


WY Counties
The distribution is based on data from 23 Wyoming counties.
U.S. Counties
The distribution is based on data from 3,142 U.S. counties and county equivalents.
WY Value
(16.3%)
The regional value is compared to the Wyoming State value.
Prior Value
(25.6%)
Prior Value compares a measured value with the previously measured value. Confidence intervals were not taken into account in determining the direction of the comparison.
