Search for Indicators
All Data
Indicator Gauge Icon Legend
Legend Colors
Red is bad, green is good, blue is not statistically different/neutral.
Compared to Distribution
 the value is in the best half of communities.
 the value is in the 2nd worst quarter of communities.
 the value is in the worst quarter of communities.
Compared to Target
 meets target;
  does not meet target.
Compared to a Single Value
 lower than the comparison value;
 higher than the comparison value;
 not statistically different from comparison value.
Trend

 non-significant change over time;
 significant change over time;
  no change over time.
Compared to Prior Value
 higher than the previous measurement period;
 lower than the previous measurement period;
 no statistically different change from previous measurement period.
County: Laramie
Community / Transportation
Value
Compared to:
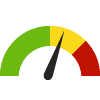
County: Laramie Workers who Drive Alone to Work
County: Laramie Workers who Drive Alone to Work
81.1%
(2018-2022)
Compared to:

WY Counties
The distribution is based on data from 23 Wyoming counties.
U.S. Counties
The distribution is based on data from 3,133 U.S. counties and county equivalents.
WY Value
(76.4%)
The regional value is compared to the Wyoming State value.
US Value
(71.7%)
The regional value is compared to the national value.
Trend
This comparison measures the indicator’s values over multiple time periods.<br>The Mann-Kendall Test for Statistical Significance is used to evaluate the trend<br>over 4 to 10 periods of measure, subject to data availability and comparability.
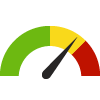
County: Laramie Workers who Walk to Work
County: Laramie Workers who Walk to Work
1.1%
(2018-2022)
Compared to:


WY Counties
The distribution is based on data from 23 Wyoming counties.
U.S. Counties
The distribution is based on data from 3,133 U.S. counties and county equivalents.
WY Value
(3.5%)
The regional value is compared to the Wyoming State value.
US Value
(2.4%)
The regional value is compared to the national value.
Trend
This comparison measures the indicator’s values over multiple time periods.<br>The Mann-Kendall Test for Statistical Significance is used to evaluate the trend<br>over 4 to 10 periods of measure, subject to data availability and comparability.
County: Laramie
Economy / Employment
Value
Compared to:
County: Laramie Employer Establishments
County: Laramie Employer Establishments
3,471
Number of Establishments
(2021)
Compared to:


Prior Value
(3,392)
Prior Value compares a measured value with the previously measured value. Confidence intervals were not taken into account in determining the direction of the comparison.
Trend
This comparison measures the indicator’s values over multiple time periods.<br>The Mann-Kendall Test for Statistical Significance is used to evaluate the trend<br>over 4 to 10 periods of measure, subject to data availability and comparability.
County: Laramie Female Population 16+ in Civilian Labor Force
County: Laramie Female Population 16+ in Civilian Labor Force
59.9%
(2018-2022)
Compared to:
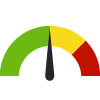

WY Counties
The distribution is based on data from 23 Wyoming counties.
U.S. Counties
The distribution is based on data from 3,133 U.S. counties and county equivalents.
WY Value
(60.2%)
The regional value is compared to the Wyoming State value.
US Value
(58.5%)
The regional value is compared to the national value.
Trend
This comparison measures the indicator’s values over multiple time periods.<br>The Mann-Kendall Test for Statistical Significance is used to evaluate the trend<br>over 4 to 10 periods of measure, subject to data availability and comparability.
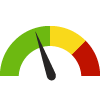
County: Laramie Population 16+ in Civilian Labor Force
County: Laramie Population 16+ in Civilian Labor Force
61.1%
(2018-2022)
Compared to:
WY Counties
The distribution is based on data from 23 Wyoming counties.
U.S. Counties
The distribution is based on data from 3,133 U.S. counties and county equivalents.
WY Value
(62.5%)
The regional value is compared to the Wyoming State value.
US Value
(59.6%)
The regional value is compared to the national value.
Trend
This comparison measures the indicator’s values over multiple time periods.<br>The Mann-Kendall Test for Statistical Significance is used to evaluate the trend<br>over 4 to 10 periods of measure, subject to data availability and comparability.
County: Laramie Size of Labor Force
County: Laramie Size of Labor Force
48,776
Persons
(January 2024)
Compared to:

Prior Value
(48,693)
Prior Value compares a measured value with the previously measured value. Confidence intervals were not taken into account in determining the direction of the comparison.
Trend
This comparison measures the indicator’s values over multiple time periods.<br>The Mann-Kendall Test for Statistical Significance is used to evaluate the trend<br>over 4 to 10 periods of measure, subject to data availability and comparability.
County: Laramie Total Employment
County: Laramie Total Employment
34,418
Paid Employees
(2021)
Compared to:


Prior Value
(34,992)
Prior Value compares a measured value with the previously measured value. Confidence intervals were not taken into account in determining the direction of the comparison.
Trend
This comparison measures the indicator’s values over multiple time periods.<br>The Mann-Kendall Test for Statistical Significance is used to evaluate the trend<br>over 4 to 10 periods of measure, subject to data availability and comparability.
County: Laramie Total Employment Change
County: Laramie Total Employment Change
-1.6%
(2020-2021)
Compared to:

WY Counties
The distribution is based on data from 23 Wyoming counties.
U.S. Counties
The distribution is based on data from 3,140 U.S. counties and county equivalents.
WY Value
(-3.6%)
The regional value is compared to the Wyoming State value.
US Value
(-4.3%)
The regional value is compared to the national value.
Prior Value
(1.1%)
Prior Value compares a measured value with the previously measured value. Confidence intervals were not taken into account in determining the direction of the comparison.
Trend
This comparison measures the indicator’s values over multiple time periods.<br>The Mann-Kendall Test for Statistical Significance is used to evaluate the trend<br>over 4 to 10 periods of measure, subject to data availability and comparability.
County: Laramie Unemployed Workers in Civilian Labor Force
County: Laramie Unemployed Workers in Civilian Labor Force
3.8%
(January 2024)
Compared to:

WY Counties
The distribution is based on data from 23 Wyoming counties.
U.S. Counties
The distribution is based on non-seasonally-adjusted data from 3,140 U.S. counties and county equivalents.
WY Value
(3.7%)
The regional value is compared to the Wyoming State value.
US Value
(4.1%)
The regional value is compared to the national value.
Prior Value
(2.7%)
Prior Value compares a measured value with the previously measured value. Confidence intervals were not taken into account in determining the direction of the comparison.
Trend
This comparison measures the indicator’s values over multiple time periods.<br>The Mann-Kendall Test for Statistical Significance is used to evaluate the trend<br>over 4 to 10 periods of measure, subject to data availability and comparability.
County: Laramie
Economy / Food Insecurity
Value
Compared to:
County: Laramie Child Food Insecurity Rate
County: Laramie Child Food Insecurity Rate
12.2%
(2021)
Compared to:
WY Counties
The distribution is based on data from 22 Wyoming counties.
U.S. Counties
The distribution is based on data from 3,140 U.S. counties and county equivalents.
WY Value
(12.2%)
The regional value is compared to the Wyoming State value.
US Value
(12.8%)
The regional value is compared to the national value.
Prior Value
(13.7%)
Prior Value compares a measured value with the previously measured value. Confidence intervals were not taken into account in determining the direction of the comparison.
Trend
This comparison measures the indicator’s values over multiple time periods.<br>The Mann-Kendall Test for Statistical Significance is used to evaluate the trend<br>over 4 to 10 periods of measure, subject to data availability and comparability.
County: Laramie Food Insecure Children Likely Ineligible for Assistance
County: Laramie Food Insecure Children Likely Ineligible for Assistance
38%
(2021)
Compared to:

WY Counties
The distribution is based on data from 22 Wyoming counties.
U.S. Counties
The distribution is based on data from 3,134 U.S. counties and county equivalents.
WY Value
(35%)
The regional value is compared to the Wyoming State value.
US Value
(25%)
The regional value is compared to the national value.
Prior Value
(37%)
Prior Value compares a measured value with the previously measured value. Confidence intervals were not taken into account in determining the direction of the comparison.
Trend
This comparison measures the indicator’s values over multiple time periods.<br>The Mann-Kendall Test for Statistical Significance is used to evaluate the trend<br>over 4 to 10 periods of measure, subject to data availability and comparability.
County: Laramie Food Insecurity Rate
County: Laramie Food Insecurity Rate
9.7%
(2021)
Compared to:
WY Counties
The distribution is based on data from 22 Wyoming counties.
U.S. Counties
The distribution is based on data from 3,140 U.S. counties and county equivalents.
WY Value
(10.6%)
The regional value is compared to the Wyoming State value.
US Value
(10.4%)
The regional value is compared to the national value.
Prior Value
(9.9%)
Prior Value compares a measured value with the previously measured value. Confidence intervals were not taken into account in determining the direction of the comparison.
Trend
This comparison measures the indicator’s values over multiple time periods.<br>The Mann-Kendall Test for Statistical Significance is used to evaluate the trend<br>over 4 to 10 periods of measure, subject to data availability and comparability.
County: Laramie Households Receiving SNAP with Children
County: Laramie Households Receiving SNAP with Children
42.4%
(2018-2022)
Compared to:


WY Value
(50.3%)
The regional value is compared to the Wyoming State value.
US Value
(47.9%)
The regional value is compared to the national value.
Trend
This comparison measures the indicator’s values over multiple time periods.<br>The Mann-Kendall Test for Statistical Significance is used to evaluate the trend<br>over 4 to 10 periods of measure, subject to data availability and comparability.
County: Laramie Households Receiving SNAP with Children (Count)
County: Laramie Households Receiving SNAP with Children (Count)
989
Households
(2018-2022)
Compared to:
Trend
This comparison measures the indicator’s values over multiple time periods.<br>The Mann-Kendall Test for Statistical Significance is used to evaluate the trend<br>over 4 to 10 periods of measure, subject to data availability and comparability.
County: Laramie Projected Child Food Insecurity Rate
County: Laramie Projected Child Food Insecurity Rate
15.6%
(2021)
Compared to:

WY Counties
The distribution is based on data from 23 Wyoming counties.
U.S. Counties
The distribution is based on data from 3,142 U.S. counties and county equivalents.
WY Value
(16.3%)
The regional value is compared to the Wyoming State value.
Prior Value
(25.6%)
Prior Value compares a measured value with the previously measured value. Confidence intervals were not taken into account in determining the direction of the comparison.
County: Laramie Projected Food Insecurity Rate
County: Laramie Projected Food Insecurity Rate
12.1%
(2021)
Compared to:
WY Counties
The distribution is based on data from 23 Wyoming counties.
U.S. Counties
The distribution is based on data from 3,142 U.S. counties and county equivalents.
WY Value
(12.9%)
The regional value is compared to the Wyoming State value.
Prior Value
(17.5%)
Prior Value compares a measured value with the previously measured value. Confidence intervals were not taken into account in determining the direction of the comparison.
County: Laramie Students Eligible for the Free Lunch Program
County: Laramie Students Eligible for the Free Lunch Program
28.1%
(2022-2023)
Compared to:
WY Counties
The distribution is based on data from 23 Wyoming counties.
U.S. Counties
The distribution is based on data from 2,710 U.S. counties and county equivalents.
WY Value
(25.0%)
The regional value is compared to the Wyoming State value.
US Value
(42.8%)
The regional value is compared to the national value.
Prior Value
(19.7%)
Prior Value compares a measured value with the previously measured value. Confidence intervals were not taken into account in determining the direction of the comparison.
Trend
This comparison measures the indicator’s values over multiple time periods.<br>The Mann-Kendall Test for Statistical Significance is used to evaluate the trend<br>over 4 to 10 periods of measure, subject to data availability and comparability.
County: Laramie
Economy / Government Assistance
Value
Compared to:
County: Laramie Households with Cash Public Assistance Income
County: Laramie Households with Cash Public Assistance Income
2.3%
(2018-2022)
Compared to:

WY Counties
The distribution is based on data from 20 Wyoming counties.
U.S. Counties
The distribution is based on data from 2,923 U.S. counties and county equivalents.
WY Value
(1.6%)
The regional value is compared to the Wyoming State value.
US Value
(2.7%)
The regional value is compared to the national value.
Trend
This comparison measures the indicator’s values over multiple time periods.<br>The Mann-Kendall Test for Statistical Significance is used to evaluate the trend<br>over 4 to 10 periods of measure, subject to data availability and comparability.
County: Laramie
Economy / Housing & Homes
Value
Compared to:
County: Laramie Homeowner Vacancy Rate
County: Laramie Homeowner Vacancy Rate
0.9%
(2018-2022)
Compared to:
WY Counties
The distribution is based on data from 23 Wyoming counties.
U.S. Counties
The distribution is based on data from 3,132 U.S. counties and county equivalents.
WY Value
(1.2%)
The regional value is compared to the Wyoming State value.
US Value
(1.1%)
The regional value is compared to the national value.
Trend
This comparison measures the indicator’s values over multiple time periods.<br>The Mann-Kendall Test for Statistical Significance is used to evaluate the trend<br>over 4 to 10 periods of measure, subject to data availability and comparability.
County: Laramie Homeownership
County: Laramie Homeownership
67.3%
(2018-2022)
Compared to:
WY Counties
The distribution is based on data from 23 Wyoming counties.
U.S. Counties
The distribution is based on data from 3,133 U.S. counties and county equivalents.
WY Value
(61.6%)
The regional value is compared to the Wyoming State value.
US Value
(57.8%)
The regional value is compared to the national value.
Trend
This comparison measures the indicator’s values over multiple time periods.<br>The Mann-Kendall Test for Statistical Significance is used to evaluate the trend<br>over 4 to 10 periods of measure, subject to data availability and comparability.
County: Laramie Housing Units
County: Laramie Housing Units
45,548
Housing units
(2022)
Compared to:
Prior Value
(44,815)
Prior Value compares a measured value with the previously measured value. Confidence intervals were not taken into account in determining the direction of the comparison.
Trend
This comparison measures the indicator’s values over multiple time periods.<br>The Mann-Kendall Test for Statistical Significance is used to evaluate the trend<br>over 4 to 10 periods of measure, subject to data availability and comparability.
County: Laramie Median Household Gross Rent
County: Laramie Median Household Gross Rent
$1,043
(2018-2022)
Compared to:
WY Counties
The distribution is based on data from 23 Wyoming counties.
WY Value
($933)
The regional value is compared to the Wyoming State value.
US Value
($1,268)
The regional value is compared to the national value.
Trend
This comparison measures the indicator’s values over multiple time periods.<br>The Mann-Kendall Test for Statistical Significance is used to evaluate the trend<br>over 4 to 10 periods of measure, subject to data availability and comparability.
County: Laramie Median Housing Unit Value
County: Laramie Median Housing Unit Value
$295,800
(2018-2022)
Compared to:
WY Counties
The distribution is based on data from 23 Wyoming counties.
WY Value
($269,900)
The regional value is compared to the Wyoming State value.
US Value
($281,900)
The regional value is compared to the national value.
Trend
This comparison measures the indicator’s values over multiple time periods.<br>The Mann-Kendall Test for Statistical Significance is used to evaluate the trend<br>over 4 to 10 periods of measure, subject to data availability and comparability.
County: Laramie Median Monthly Owner Costs for Households without a Mortgage
County: Laramie Median Monthly Owner Costs for Households without a Mortgage
$541
(2018-2022)
Compared to:
WY Counties
The distribution is based on data from 23 Wyoming counties.
WY Value
($489)
The regional value is compared to the Wyoming State value.
US Value
($584)
The regional value is compared to the national value.
Trend
This comparison measures the indicator’s values over multiple time periods.<br>The Mann-Kendall Test for Statistical Significance is used to evaluate the trend<br>over 4 to 10 periods of measure, subject to data availability and comparability.
County: Laramie Mortgaged Owners Median Monthly Household Costs
County: Laramie Mortgaged Owners Median Monthly Household Costs
$1,713
(2018-2022)
Compared to:
WY Counties
The distribution is based on data from 23 Wyoming counties.
WY Value
($1,642)
The regional value is compared to the Wyoming State value.
US Value
($1,828)
The regional value is compared to the national value.
Trend
This comparison measures the indicator’s values over multiple time periods.<br>The Mann-Kendall Test for Statistical Significance is used to evaluate the trend<br>over 4 to 10 periods of measure, subject to data availability and comparability.
28.3%
(2022)
Compared to:
U.S. Counties
The distribution is based on data from 828 U.S. counties and county equivalents.
WY Value
(26.2%)
The regional value is compared to the Wyoming State value.
US Value
(27.8%)
The regional value is compared to the national value.
Prior Value
(34.5%)
Prior Value compares a measured value with the previously measured value. Confidence intervals were not taken into account in determining the direction of the comparison.
Trend
This comparison measures the indicator’s values over multiple time periods.<br>The Mann-Kendall Test for Statistical Significance is used to evaluate the trend<br>over 4 to 10 periods of measure, subject to data availability and comparability.
HP 2030 Target
(25.5%)
County: Laramie Overcrowded Households
County: Laramie Overcrowded Households
0.9%
(2018-2022)
Compared to:
WY Counties
The distribution is based on data from 23 Wyoming counties.
WY Value
(1.8%)
The regional value is compared to the Wyoming State value.
US Value
(3.4%)
The regional value is compared to the national value.
Trend
This comparison measures the indicator’s values over multiple time periods.<br>The Mann-Kendall Test for Statistical Significance is used to evaluate the trend<br>over 4 to 10 periods of measure, subject to data availability and comparability.
County: Laramie Renters Spending 30% or More of Household Income on Rent
County: Laramie Renters Spending 30% or More of Household Income on Rent
46.1%
(2018-2022)
Compared to:
WY Counties
The distribution is based on data from 23 Wyoming counties.
U.S. Counties
The distribution is based on data from 3,132 U.S. counties and county equivalents.
WY Value
(43.4%)
The regional value is compared to the Wyoming State value.
US Value
(49.9%)
The regional value is compared to the national value.
Trend
This comparison measures the indicator’s values over multiple time periods.<br>The Mann-Kendall Test for Statistical Significance is used to evaluate the trend<br>over 4 to 10 periods of measure, subject to data availability and comparability.
HP 2030 Target
(25.5%)
County: Laramie Severe Housing Problems
County: Laramie Severe Housing Problems
11.2%
(2016-2020)
Compared to:
WY Counties
The distribution is based on data from 23 Wyoming counties.
U.S. Counties
The distribution is based on data from 3,141 U.S. counties and county equivalents.
WY Value
(12.1%)
The regional value is compared to the Wyoming State value.
US Value
(16.7%)
The regional value is compared to the national value.
Prior Value
(11.9%)
Prior Value compares a measured value with the previously measured value. Confidence intervals were taken into account in determining the direction of the comparison.
Trend
This comparison measures the indicator’s values over multiple time periods.<br>The Mann-Kendall Test for Statistical Significance is used to evaluate the trend<br>over 4 to 10 periods of measure, subject to data availability and comparability.
County: Laramie
Economy / Income
Value
Compared to:
County: Laramie Gender Pay Gap
County: Laramie Gender Pay Gap
$0.76
Cents on the dollar
(2022)
Compared to:
WY Value
($0.65)
The regional value is compared to the Wyoming State value.
US Value
($0.73)
The regional value is compared to the national value.
Prior Value
($0.64)
Prior Value compares a measured value with the previously measured value. Confidence intervals were not taken into account in determining the direction of the comparison.
Trend
This comparison measures the indicator’s values over multiple time periods.<br>The Mann-Kendall Test for Statistical Significance is used to evaluate the trend<br>over 4 to 10 periods of measure, subject to data availability and comparability.
68.4%
(2021)
Compared to:
WY Counties
The distribution is based on data from 23 Wyoming counties.
WY Value
(67.0%)
The regional value is compared to the Wyoming State value.
Prior Value
(68.2%)
Prior Value compares a measured value with the previously measured value. Confidence intervals were not taken into account in determining the direction of the comparison.
21.2%
(2021)
Compared to:
WY Counties
The distribution is based on data from 23 Wyoming counties.
WY Value
(22.0%)
The regional value is compared to the Wyoming State value.
Prior Value
(24.3%)
Prior Value compares a measured value with the previously measured value. Confidence intervals were not taken into account in determining the direction of the comparison.
County: Laramie Income Inequality
County: Laramie Income Inequality
0.439
(2018-2022)
Compared to:
WY Counties
The distribution is based on data from 23 Wyoming counties.
U.S. Counties
The distribution is based on data from 3,133 U.S. counties and county equivalents.
WY Value
(0.448)
The regional value is compared to the Wyoming State value.
US Value
(0.483)
The regional value is compared to the national value.
Trend
This comparison measures the indicator’s values over multiple time periods.<br>The Mann-Kendall Test for Statistical Significance is used to evaluate the trend<br>over 4 to 10 periods of measure, subject to data availability and comparability.
County: Laramie Median Household Income
County: Laramie Median Household Income
$76,282
(2018-2022)
Compared to:
WY Counties
The distribution is based on data from 23 Wyoming counties.
U.S. Counties
The distribution is based on data from 3,132 U.S. counties and county equivalents.
WY Value
($72,495)
The regional value is compared to the Wyoming State value.
US Value
($75,149)
The regional value is compared to the national value.
Trend
This comparison measures the indicator’s values over multiple time periods.<br>The Mann-Kendall Test for Statistical Significance is used to evaluate the trend<br>over 4 to 10 periods of measure, subject to data availability and comparability.
County: Laramie Per Capita Income
County: Laramie Per Capita Income
$41,104
(2018-2022)
Compared to:
WY Counties
The distribution is based on data from 23 Wyoming counties.
U.S. Counties
The distribution is based on data from 3,133 U.S. counties and county equivalents.
WY Value
($39,547)
The regional value is compared to the Wyoming State value.
US Value
($41,261)
The regional value is compared to the national value.
Trend
This comparison measures the indicator’s values over multiple time periods.<br>The Mann-Kendall Test for Statistical Significance is used to evaluate the trend<br>over 4 to 10 periods of measure, subject to data availability and comparability.
County: Laramie
Economy / Poverty
Value
Compared to:
County: Laramie Children Living Below 200% of Poverty Level
County: Laramie Children Living Below 200% of Poverty Level
36.8%
(2022)
Compared to:
U.S. Counties
The distribution is based on data from 828 U.S. counties and county equivalents.
WY Value
(33.0%)
The regional value is compared to the Wyoming State value.
US Value
(36.5%)
The regional value is compared to the national value.
Prior Value
(35.0%)
Prior Value compares a measured value with the previously measured value. Confidence intervals were not taken into account in determining the direction of the comparison.
Trend
This comparison measures the indicator’s values over multiple time periods.<br>The Mann-Kendall Test for Statistical Significance is used to evaluate the trend<br>over 4 to 10 periods of measure, subject to data availability and comparability.
County: Laramie Children Living Below Poverty Level
County: Laramie Children Living Below Poverty Level
12.4%
(2018-2022)
Compared to:
WY Counties
The distribution is based on data from 23 Wyoming counties.
U.S. Counties
The distribution is based on data from 3,132 U.S. counties and county equivalents.
WY Value
(12.6%)
The regional value is compared to the Wyoming State value.
US Value
(16.7%)
The regional value is compared to the national value.
Trend
This comparison measures the indicator’s values over multiple time periods.<br>The Mann-Kendall Test for Statistical Significance is used to evaluate the trend<br>over 4 to 10 periods of measure, subject to data availability and comparability.
County: Laramie Families Living Below 200% of Poverty Level
County: Laramie Families Living Below 200% of Poverty Level
20.4%
(2022)
Compared to:
U.S. Counties
The distribution is based on data from 825 U.S. counties and county equivalents.
WY Value
(20.9%)
The regional value is compared to the Wyoming State value.
US Value
(22.5%)
The regional value is compared to the national value.
Prior Value
(21.1%)
Prior Value compares a measured value with the previously measured value. Confidence intervals were not taken into account in determining the direction of the comparison.
Trend
This comparison measures the indicator’s values over multiple time periods.<br>The Mann-Kendall Test for Statistical Significance is used to evaluate the trend<br>over 4 to 10 periods of measure, subject to data availability and comparability.
County: Laramie Families Living Below Poverty Level
County: Laramie Families Living Below Poverty Level
5.8%
(2018-2022)
Compared to:
WY Counties
The distribution is based on data from 23 Wyoming counties.
U.S. Counties
The distribution is based on data from 3,104 U.S. counties and county equivalents.
WY Value
(6.8%)
The regional value is compared to the Wyoming State value.
US Value
(8.8%)
The regional value is compared to the national value.
Trend
This comparison measures the indicator’s values over multiple time periods.<br>The Mann-Kendall Test for Statistical Significance is used to evaluate the trend<br>over 4 to 10 periods of measure, subject to data availability and comparability.
County: Laramie Households Living Below Poverty Level
County: Laramie Households Living Below Poverty Level
10.5%
(2021)
Compared to:
WY Counties
The distribution is based on data from 23 Wyoming counties.
WY Value
(11.0%)
The regional value is compared to the Wyoming State value.
Prior Value
(7.5%)
Prior Value compares a measured value with the previously measured value. Confidence intervals were not taken into account in determining the direction of the comparison.
County: Laramie People 65+ Living Below 200% of Poverty Level
County: Laramie People 65+ Living Below 200% of Poverty Level
27.1%
(2022)
Compared to:
U.S. Counties
The distribution is based on data from 828 U.S. counties and county equivalents.
WY Value
(26.5%)
The regional value is compared to the Wyoming State value.
US Value
(28.0%)
The regional value is compared to the national value.
Prior Value
(25.5%)
Prior Value compares a measured value with the previously measured value. Confidence intervals were not taken into account in determining the direction of the comparison.
Trend
This comparison measures the indicator’s values over multiple time periods.<br>The Mann-Kendall Test for Statistical Significance is used to evaluate the trend<br>over 4 to 10 periods of measure, subject to data availability and comparability.
County: Laramie People 65+ Living Below Poverty Level
County: Laramie People 65+ Living Below Poverty Level
5.4%
(2018-2022)
Compared to:
WY Counties
The distribution is based on data from 23 Wyoming counties.
U.S. Counties
The distribution is based on data from 3,133 U.S. counties and county equivalents.
WY Value
(7.7%)
The regional value is compared to the Wyoming State value.
US Value
(10.0%)
The regional value is compared to the national value.
Trend
This comparison measures the indicator’s values over multiple time periods.<br>The Mann-Kendall Test for Statistical Significance is used to evaluate the trend<br>over 4 to 10 periods of measure, subject to data availability and comparability.
County: Laramie People 65+ Living Below Poverty Level (Count)
County: Laramie People 65+ Living Below Poverty Level (Count)
878
People
(2018-2022)
Compared to:
Trend
This comparison measures the indicator’s values over multiple time periods.<br>The Mann-Kendall Test for Statistical Significance is used to evaluate the trend<br>over 4 to 10 periods of measure, subject to data availability and comparability.
County: Laramie People Living 200% Above Poverty Level
County: Laramie People Living 200% Above Poverty Level
76.8%
(2018-2022)
Compared to:
WY Counties
The distribution is based on data from 23 Wyoming counties.
U.S. Counties
The distribution is based on data from 3,133 U.S. counties and county equivalents.
WY Value
(73.9%)
The regional value is compared to the Wyoming State value.
US Value
(71.2%)
The regional value is compared to the national value.
Trend
This comparison measures the indicator’s values over multiple time periods.<br>The Mann-Kendall Test for Statistical Significance is used to evaluate the trend<br>over 4 to 10 periods of measure, subject to data availability and comparability.
County: Laramie People Living Below 200% of Poverty Level
County: Laramie People Living Below 200% of Poverty Level
26.9%
(2022)
Compared to:
U.S. Counties
The distribution is based on data from 828 U.S. counties and county equivalents.
WY Value
(27.3%)
The regional value is compared to the Wyoming State value.
US Value
(28.4%)
The regional value is compared to the national value.
Prior Value
(26.7%)
Prior Value compares a measured value with the previously measured value. Confidence intervals were not taken into account in determining the direction of the comparison.
Trend
This comparison measures the indicator’s values over multiple time periods.<br>The Mann-Kendall Test for Statistical Significance is used to evaluate the trend<br>over 4 to 10 periods of measure, subject to data availability and comparability.
County: Laramie People Living Below Poverty Level
County: Laramie People Living Below Poverty Level
9.0%
(2018-2022)
Compared to:
WY Counties
The distribution is based on data from 23 Wyoming counties.
U.S. Counties
The distribution is based on data from 3,133 U.S. counties and county equivalents.
WY Value
(10.7%)
The regional value is compared to the Wyoming State value.
US Value
(12.5%)
The regional value is compared to the national value.
Trend
This comparison measures the indicator’s values over multiple time periods.<br>The Mann-Kendall Test for Statistical Significance is used to evaluate the trend<br>over 4 to 10 periods of measure, subject to data availability and comparability.
HP 2030 Target
(8.0%)
County: Laramie Youth not in School or Working
County: Laramie Youth not in School or Working
2.3%
(2018-2022)
Compared to:
WY Counties
(2017-2021)
The distribution is based on data from 23 Wyoming counties.
U.S. Counties
The distribution is based on data from 3,130 U.S. counties and county equivalents.
WY Value
(2.0%)
The regional value is compared to the Wyoming State value.
US Value
(1.8%)
The regional value is compared to the national value.
Trend
This comparison measures the indicator’s values over multiple time periods.<br>The Mann-Kendall Test for Statistical Significance is used to evaluate the trend<br>over 4 to 10 periods of measure, subject to data availability and comparability.
County: Laramie
Education / Childcare & Early Childhood Education
Value
Compared to:
County: Laramie Child Care Centers
County: Laramie Child Care Centers
7.3
Per 1,000 population under age 5
(2022)
Compared to:
WY Counties
The distribution is based on data from 23 Wyoming counties.
WY Value
(9.7)
The regional value is compared to the Wyoming State value.
US Value
(7.0)
The regional value is compared to the national value.
Prior Value
(10.9)
Prior Value compares a measured value with the previously measured value. Confidence intervals were not taken into account in determining the direction of the comparison.
County: Laramie
Education / Educational Attainment
Value
Compared to:
County: Laramie People 25+ with a Bachelor's Degree or Higher
County: Laramie People 25+ with a Bachelor's Degree or Higher
30.5%
(2018-2022)
Compared to:
WY Counties
The distribution is based on data from 23 Wyoming counties.
U.S. Counties
The distribution is based on data from 3,133 U.S. counties and county equivalents.
WY Value
(29.0%)
The regional value is compared to the Wyoming State value.
US Value
(34.3%)
The regional value is compared to the national value.
Trend
This comparison measures the indicator’s values over multiple time periods.<br>The Mann-Kendall Test for Statistical Significance is used to evaluate the trend<br>over 4 to 10 periods of measure, subject to data availability and comparability.
County: Laramie People 25+ with a High School Diploma or Higher
County: Laramie People 25+ with a High School Diploma or Higher
94.3%
(2018-2022)
Compared to:
WY Counties
The distribution is based on data from 23 Wyoming counties.
U.S. Counties
The distribution is based on data from 3,133 U.S. counties and county equivalents.
WY Value
(93.9%)
The regional value is compared to the Wyoming State value.
US Value
(89.1%)
The regional value is compared to the national value.
Trend
This comparison measures the indicator’s values over multiple time periods.<br>The Mann-Kendall Test for Statistical Significance is used to evaluate the trend<br>over 4 to 10 periods of measure, subject to data availability and comparability.
County: Laramie
Education / School Environment
Value
Compared to:
County: Laramie Student-to-Teacher Ratio
County: Laramie Student-to-Teacher Ratio
13.4
Students per teacher
(2022-2023)
Compared to:
WY Counties
The distribution is based on data from 23 Wyoming counties.
U.S. Counties
The distribution is based on data from 3,125 U.S. counties and county equivalents.
WY Value
(12.7)
The regional value is compared to the Wyoming State value.
US Value
(15.4)
The regional value is compared to the national value.
Prior Value
(13.6)
Prior Value compares a measured value with the previously measured value. Confidence intervals were not taken into account in determining the direction of the comparison.
Trend
This comparison measures the indicator’s values over multiple time periods.<br>The Mann-Kendall Test for Statistical Significance is used to evaluate the trend<br>over 4 to 10 periods of measure, subject to data availability and comparability.
County: Laramie
Environmental Health / Air
Value
Compared to:
County: Laramie Annual Particle Pollution
County: Laramie Annual Particle Pollution
4
(2019-2021)
Compared to:
Air Quality Index
The American Lung Association (ALA) assigns grades A-F to counties (A=1; B=2; C=3; D=4; F=5), based on average annual number of days that particle pollution levels exceeded U.S. standards during the three year measurement period. The five-point grading scale was used for the distribution (Green = <2; Yellow = 2 - 3; Red = >3). The air quality data is collected by the EPA and summarized by the ALA.
Prior Value
(4)
Prior Value compares a measured value with the previously measured value. Confidence intervals were not taken into account in determining the direction of the comparison.
Trend
This comparison measures the indicator’s values over multiple time periods.<br>The Mann-Kendall Test for Statistical Significance is used to evaluate the trend<br>over 4 to 10 periods of measure, subject to data availability and comparability.
County: Laramie Recognized Carcinogens Released into Air
County: Laramie Recognized Carcinogens Released into Air
13,591
Pounds
(2022)
Compared to:
Prior Value
(10,677)
Prior Value compares a measured value with the previously measured value. Confidence intervals were not taken into account in determining the direction of the comparison.
Trend
This comparison measures the indicator’s values over multiple time periods.<br>The Mann-Kendall Test for Statistical Significance is used to evaluate the trend<br>over 4 to 10 periods of measure, subject to data availability and comparability.
County: Laramie
Environmental Health / Built Environment
Value
Compared to:
County: Laramie Access to Exercise Opportunities
County: Laramie Access to Exercise Opportunities
71.1%
(2024)
Compared to:
WY Counties
The distribution is based on data from 23 Wyoming counties.
U.S. Counties
The distribution is based on data from 3,096 U.S. counties and county equivalents.
WY Value
(77.9%)
The regional value is compared to the Wyoming State value.
US Value
(84.1%)
The regional value is compared to the national value.
Prior Value
(67.1%)
Prior Value compares a measured value with the previously measured value. Confidence intervals were not taken into account in determining the direction of the comparison.
County: Laramie Access to Parks
County: Laramie Access to Parks
49.6%
(2020)
Compared to:
WY Counties
The distribution is based on data from 23 Wyoming counties.
WY Value
(63.3%)
The regional value is compared to the Wyoming State value.
Prior Value
(50.5%)
Prior Value compares a measured value with the previously measured value. Confidence intervals were not taken into account in determining the direction of the comparison.
County: Laramie Food Environment Index
County: Laramie Food Environment Index
7.6
(2024)
Compared to:
WY Counties
The distribution is based on data from 23 Wyoming counties.
U.S. Counties
The distribution is based on data from 3,108 U.S. counties and county equivalents.
WY Value
(7.1)
The regional value is compared to the Wyoming State value.
US Value
(7.7)
The regional value is compared to the national value.
Prior Value
(7.6)
Prior Value compares a measured value with the previously measured value. Confidence intervals were not taken into account in determining the direction of the comparison.
Trend
This comparison measures the indicator’s values over multiple time periods.<br>The Mann-Kendall Test for Statistical Significance is used to evaluate the trend<br>over 4 to 10 periods of measure, subject to data availability and comparability.
County: Laramie Proximity to Highways
County: Laramie Proximity to Highways
10.0%
(2020)
Compared to:
WY Counties
The distribution is based on data from 23 Wyoming counties.
WY Value
(6.8%)
The regional value is compared to the Wyoming State value.
Prior Value
(10.7%)
Prior Value compares a measured value with the previously measured value. Confidence intervals were not taken into account in determining the direction of the comparison.
County: Laramie
Environmental Health / Toxins & Contaminants
Value
Compared to:
County: Laramie PBT Released
County: Laramie PBT Released
20
Pounds
(2022)
Compared to:
Prior Value
(3)
Prior Value compares a measured value with the previously measured value. Confidence intervals were not taken into account in determining the direction of the comparison.
Trend
This comparison measures the indicator’s values over multiple time periods.<br>The Mann-Kendall Test for Statistical Significance is used to evaluate the trend<br>over 4 to 10 periods of measure, subject to data availability and comparability.
County: Laramie
Environmental Health / Weather & Climate
Value
Compared to:
County: Laramie Daily Dose of UV Irradiance
County: Laramie Daily Dose of UV Irradiance
3,662.0
Joule per square meter
(2020)
Compared to:
WY Counties
The distribution is based on data from 23 Wyoming counties.
WY Value
(3,720.0)
The regional value is compared to the Wyoming State value.
Prior Value
(3,516.0)
Prior Value compares a measured value with the previously measured value. Confidence intervals were not taken into account in determining the direction of the comparison.
Trend
This comparison measures the indicator’s values over multiple time periods.<br>The Mann-Kendall Test for Statistical Significance is used to evaluate the trend<br>over 4 to 10 periods of measure, subject to data availability and comparability.
County: Laramie Number of Extreme Heat Days
County: Laramie Number of Extreme Heat Days
22
Days
(2021)
Compared to:
Prior Value
(26)
Prior Value compares a measured value with the previously measured value. Confidence intervals were not taken into account in determining the direction of the comparison.
Trend
This comparison measures the indicator’s values over multiple time periods.<br>The Mann-Kendall Test for Statistical Significance is used to evaluate the trend<br>over 4 to 10 periods of measure, subject to data availability and comparability.
County: Laramie Number of Extreme Heat Events
County: Laramie Number of Extreme Heat Events
16
Events
(2021)
Compared to:
Prior Value
(22)
Prior Value compares a measured value with the previously measured value. Confidence intervals were not taken into account in determining the direction of the comparison.
Trend
This comparison measures the indicator’s values over multiple time periods.<br>The Mann-Kendall Test for Statistical Significance is used to evaluate the trend<br>over 4 to 10 periods of measure, subject to data availability and comparability.
County: Laramie Number of Extreme Precipitation Days
County: Laramie Number of Extreme Precipitation Days
16
Days
(2021)
Compared to:
Prior Value
(23)
Prior Value compares a measured value with the previously measured value. Confidence intervals were not taken into account in determining the direction of the comparison.
Trend
This comparison measures the indicator’s values over multiple time periods.<br>The Mann-Kendall Test for Statistical Significance is used to evaluate the trend<br>over 4 to 10 periods of measure, subject to data availability and comparability.
County: Laramie Weeks of Moderate Drought or Worse
County: Laramie Weeks of Moderate Drought or Worse
23
Weeks per year
(2021)
Compared to:
Prior Value
(20)
Prior Value compares a measured value with the previously measured value. Confidence intervals were not taken into account in determining the direction of the comparison.
Trend
This comparison measures the indicator’s values over multiple time periods.<br>The Mann-Kendall Test for Statistical Significance is used to evaluate the trend<br>over 4 to 10 periods of measure, subject to data availability and comparability.
